


Want to see Spyderbat in action?


DoorDash engineering recently authored a blog detailing how they built an eBPF capability to solve various network observability use cases. Using eBPF technology, we’re now able to get very detailed context (and attribution to the workloads) on the source and destination of network connections, their payloads, and more, at runtime. Furthermore, this can be done in a very safe and efficient way without the need for more cumbersome methods like raw packet capture, netflow/flow logs and other methods. Let’s look at how eBPF, combined with Cloud (and K8s) APIs, allows us to build a fabric of context that answers a set of common (network oriented) questions for infrastructure and security teams.
How We Do It
Core to building this fabric is probing (with kprobes) a couple of places with eBPF for both TCP and UDP network traffic:
- sock_sendmsg
- sock_recvmsg
With this network information, we’re able to understand the protocol name, source and destination ports, and other socket data structures that can be further decoded (e.g. DNS query and response). Critically though, we’re also able to tie the network connections back to the processes that originate (or terminate) them. This is a really big deal because it allows us to link the activity inside a workload (e.g. a container or a VM) with its network activity.

Tying Workload Activity to Network Activity
Here’s a simple example below from the Spyderbat Platform below where we have a Python process, in this case in a container inside a K8s cluster doing a DNS (UDP) “Type 1” (A record) query for AWS S3 - “s3.amazonaws.com” and then connecting via TCP to the AWS S3 service 71ms later. Also note that the DNS domain name is associated with the TCP connection endpoint (S3) for additional context. Other relevant (Kubernetes) context is also associated with the pod, including (source) namespace and Cluster membership. In short, just by looking at one “side” of the network connection, we glean a wealth of information. Furthermore, because of where we inspect the Kernel using eBPF, this approach can be used with any underlying Container Network Interface (CNI) or Service Mesh in use - in fact, it can be used to introspect how a Service Mesh is working under the covers (more on that later).
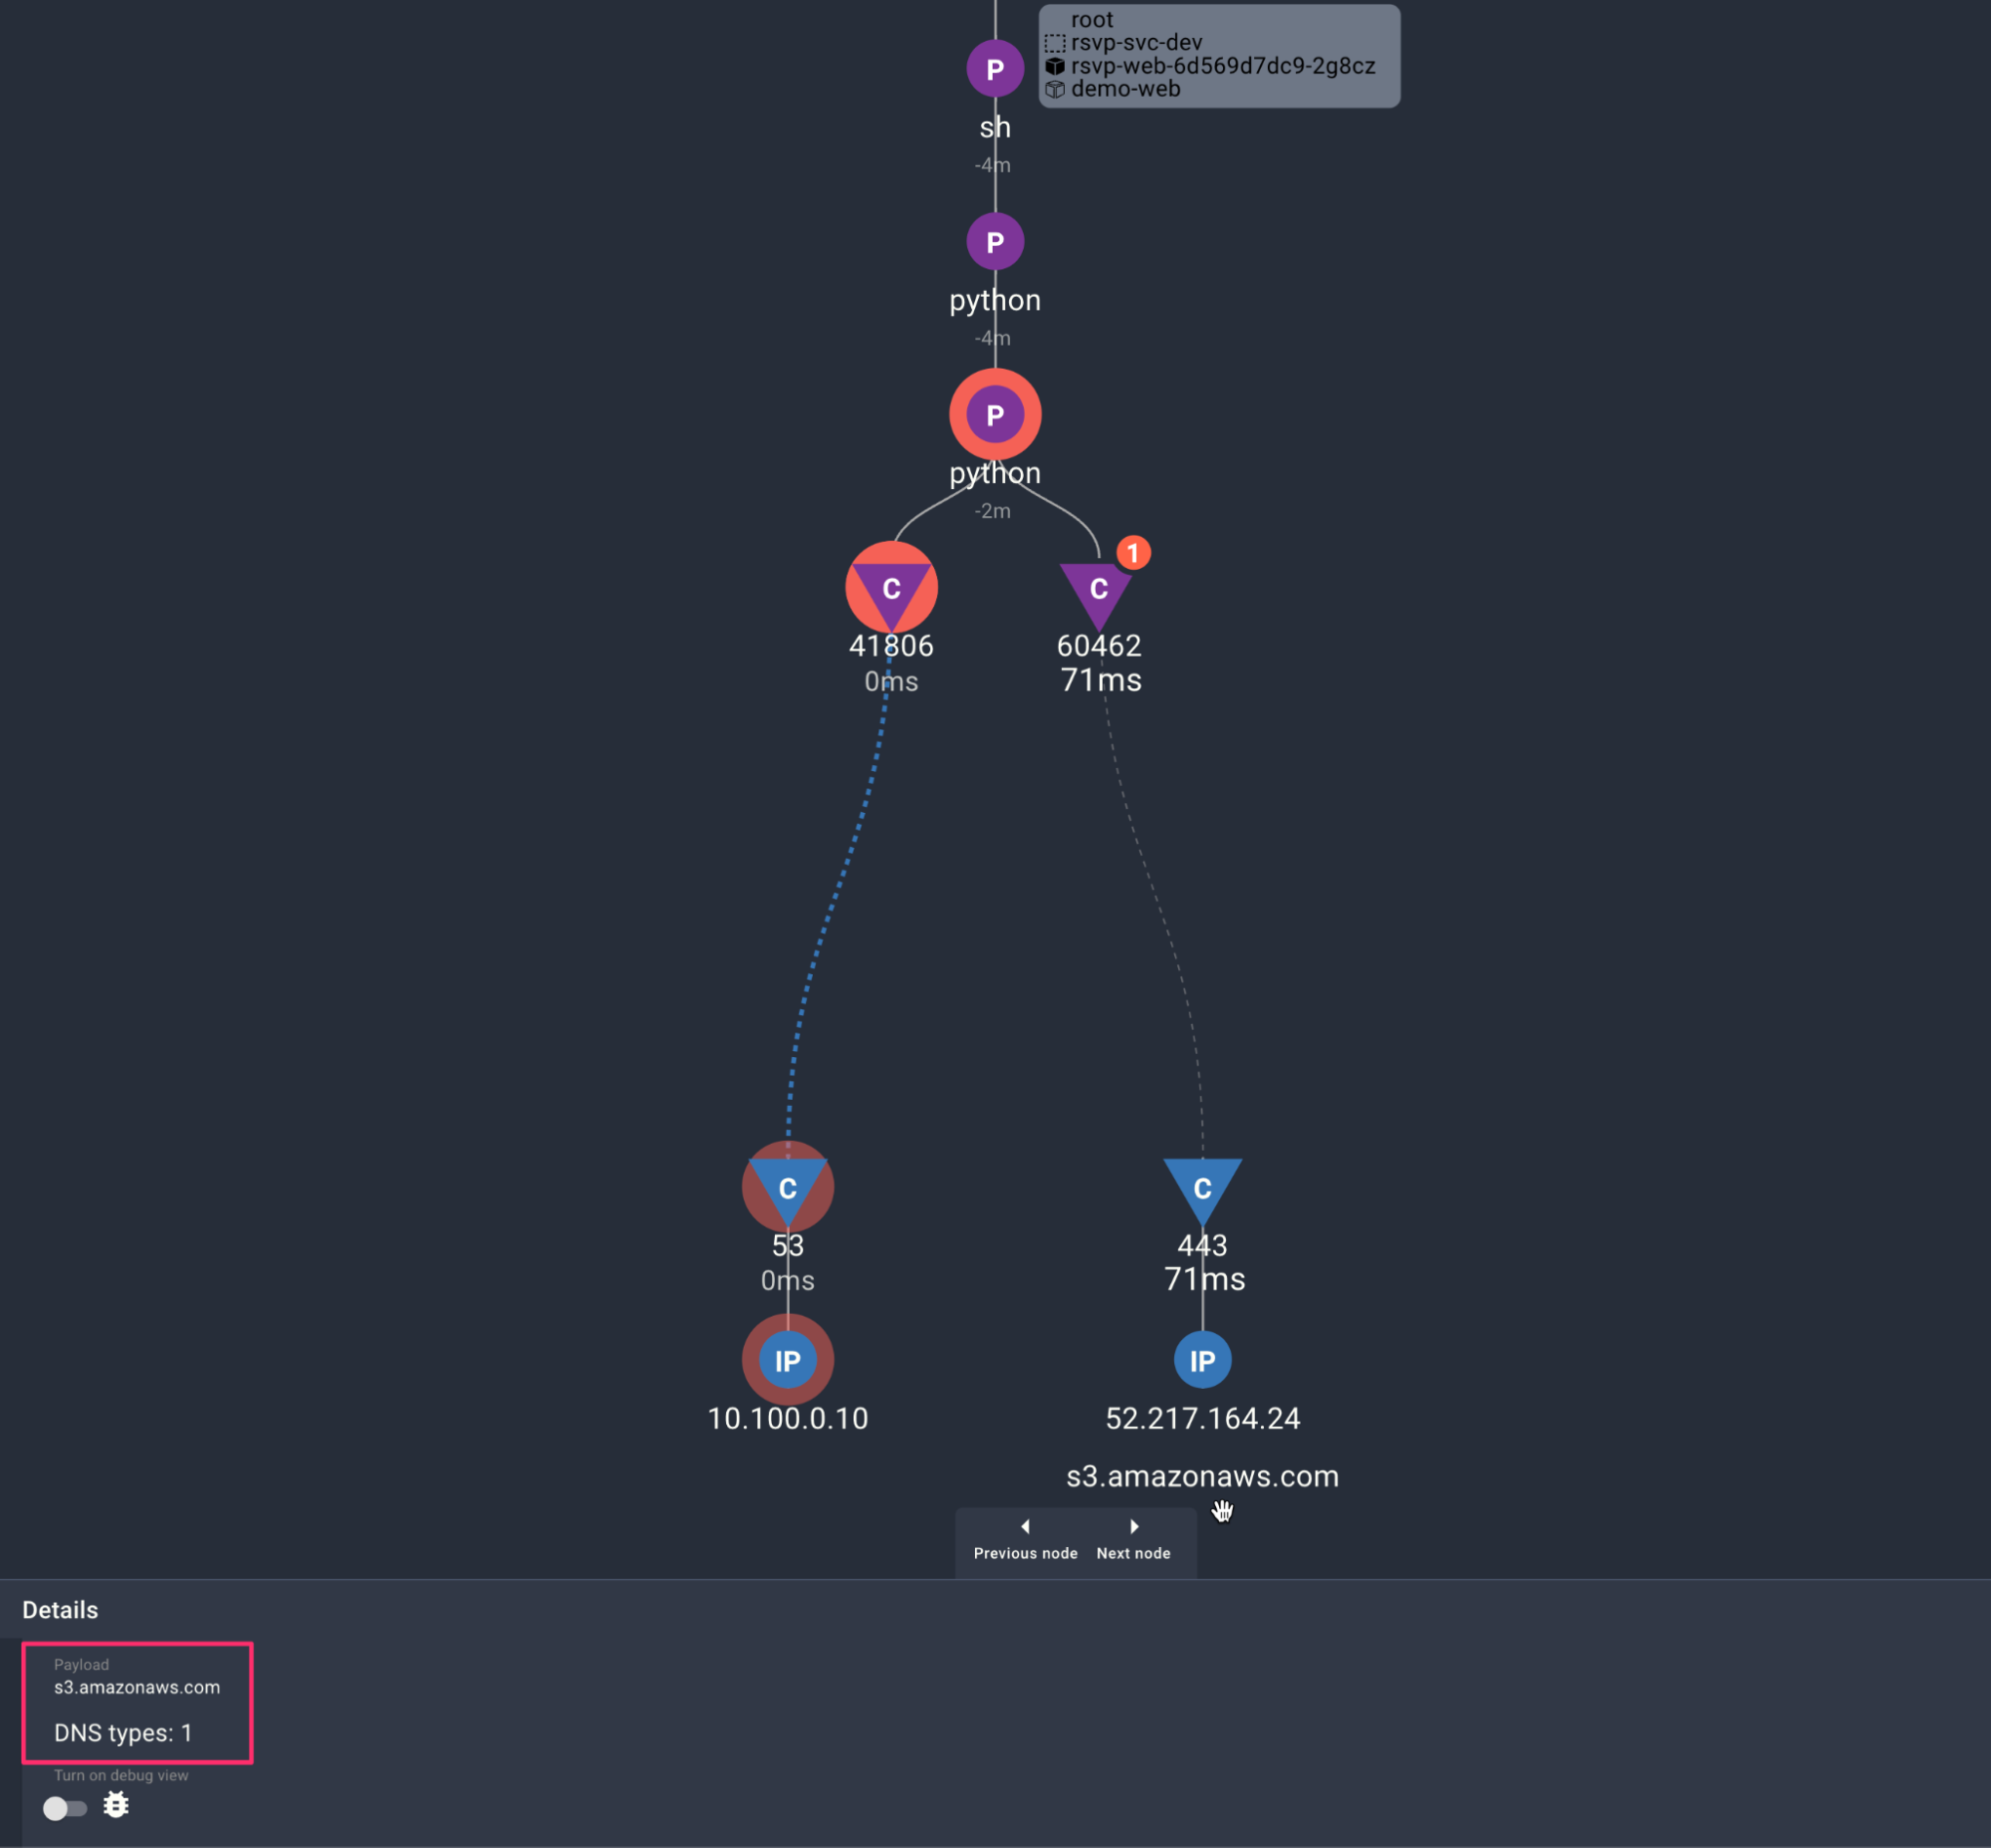
DNS Query followed by a TCP connection from inside a container to AWS S3
What can we do with that?
Starting on the DNS side, we get a lot of granular information. As pointed out by DoorDash, typical DNS metrics yield node level metrics which cannot be further broken down by specific DNS question or source pod for example. With eBPF data combined with Kubernetes API context, infrastructure teams can now answer questions like:
- Which pods, containers, and processes are making the most DNS queries? (i.e. DNS hotspots)
- Which DNS domains (questions) are being queried the most? How is that broken out by source pod, container, and process? (and associated context like source namespace and cluster)
- Which external vs internal domains are being queried, again broken down by pod, container and process?
We can also help inform security with things like egress filtering rules. That is, what should the egress filtering rules be set to, based on observing the actual underlying application behavior. By understanding the external DNS domains being actually queried, we have the information now to go set these rules appropriately.
Many security threat intel solutions are triggered when “bad” DNS domains are queried (e.g. threat list, associated crypto domains etc..) By keeping track of what pods, containers and processes are actually generating those DNS queries, we get full attribution on when those domains are being called, down to the process level. We explore this topic specifically for using eBPF to resolve GuardDuty DNS alerts in a recent blog.
More generally, since we can associate the remote domain/hostname with a connection, we can find connections that are going to “unmanaged” endpoints (i.e. those without available eBPF instrumentation on the other side) - think AWS (or any other Cloud) services like S3, EKS and many others. So we can answer questions like:
- Show me all the pods, containers, processes that are connecting to AWS S3 [insert relevant AWS or Cloud service]
- Show me all the pods, containers, processes that are connecting to the K8s API (even though for EKS that is managed on the AWS side) e.g. show me all the pods connecting to kubernetes.default.svc.cluster.local
Another way to look at it is that by understanding where the connection is going via the remote hostname, we get detailed observability into “north-south” traffic for the cluster.
There’s a theme here that starts to emerge once we can really observe runtime with the necessary context. Configuring (and automating configuration of) Cloud infrastructure has become trivial, but knowing how to configure it is not. By leveraging eBPF and associated context, we create feedback loops from “runtime to configuration time”, giving us insight into how our infrastructure configurations should be set based on actual observed application behavior.
What about service to service connections?
It turns out that when we have the eBPF instrumentation referenced above, running on both the source and target nodes, it is possible to “stitch” together both ends of the connection, even in the presence of Network (& port) address translation NAT (really multiple NATs….). To be clear, we have various levels of network translation (NAT) going on, even inside a single cluster, dependent on the CNI being used (anyone who’s tried to trace out a Kubernetes network connection before knows what I’m talking about).
Once we have these workload to workload connections, we can understand which pod is talking to which pod, container to container and process to process and so on - in short, we can build a dependency map for our services. Put another way, we get amazing insight into “east-west” traffic.
Service to Service Connections
So what can we do with it? Quite a lot it turns out.
Single Cluster
In addition to being generally helpful for troubleshooting a given service now we know its downstream and upstream dependencies, what else can we do with this dependency map of connections between our workloads in a single cluster?
- Moves, adds and changes - DoorDash reference a couple of use cases here such as:
- Moving away from shared databases, understanding downstream connections from pods/applications that continue to use the shared database vs service dedicated storage.
- Migration to a new service discovery (Consul in the case mentioned), and finding which clients have (and have not) migrated e.g. show all the connections from apps to Consul, or show all the apps that don’t have connections going to Consul etc…
- Cross Namespace Traffic
- A common question that gets asked is “what pods are communicating across namespaces?” - sometimes this is intended, sometimes it isn’t. For example, in the screenshot below, we can see the Web server in the dev namespace initiating connections to the MongDB service/pods in the prod namespace - that may not be the intended behavior…
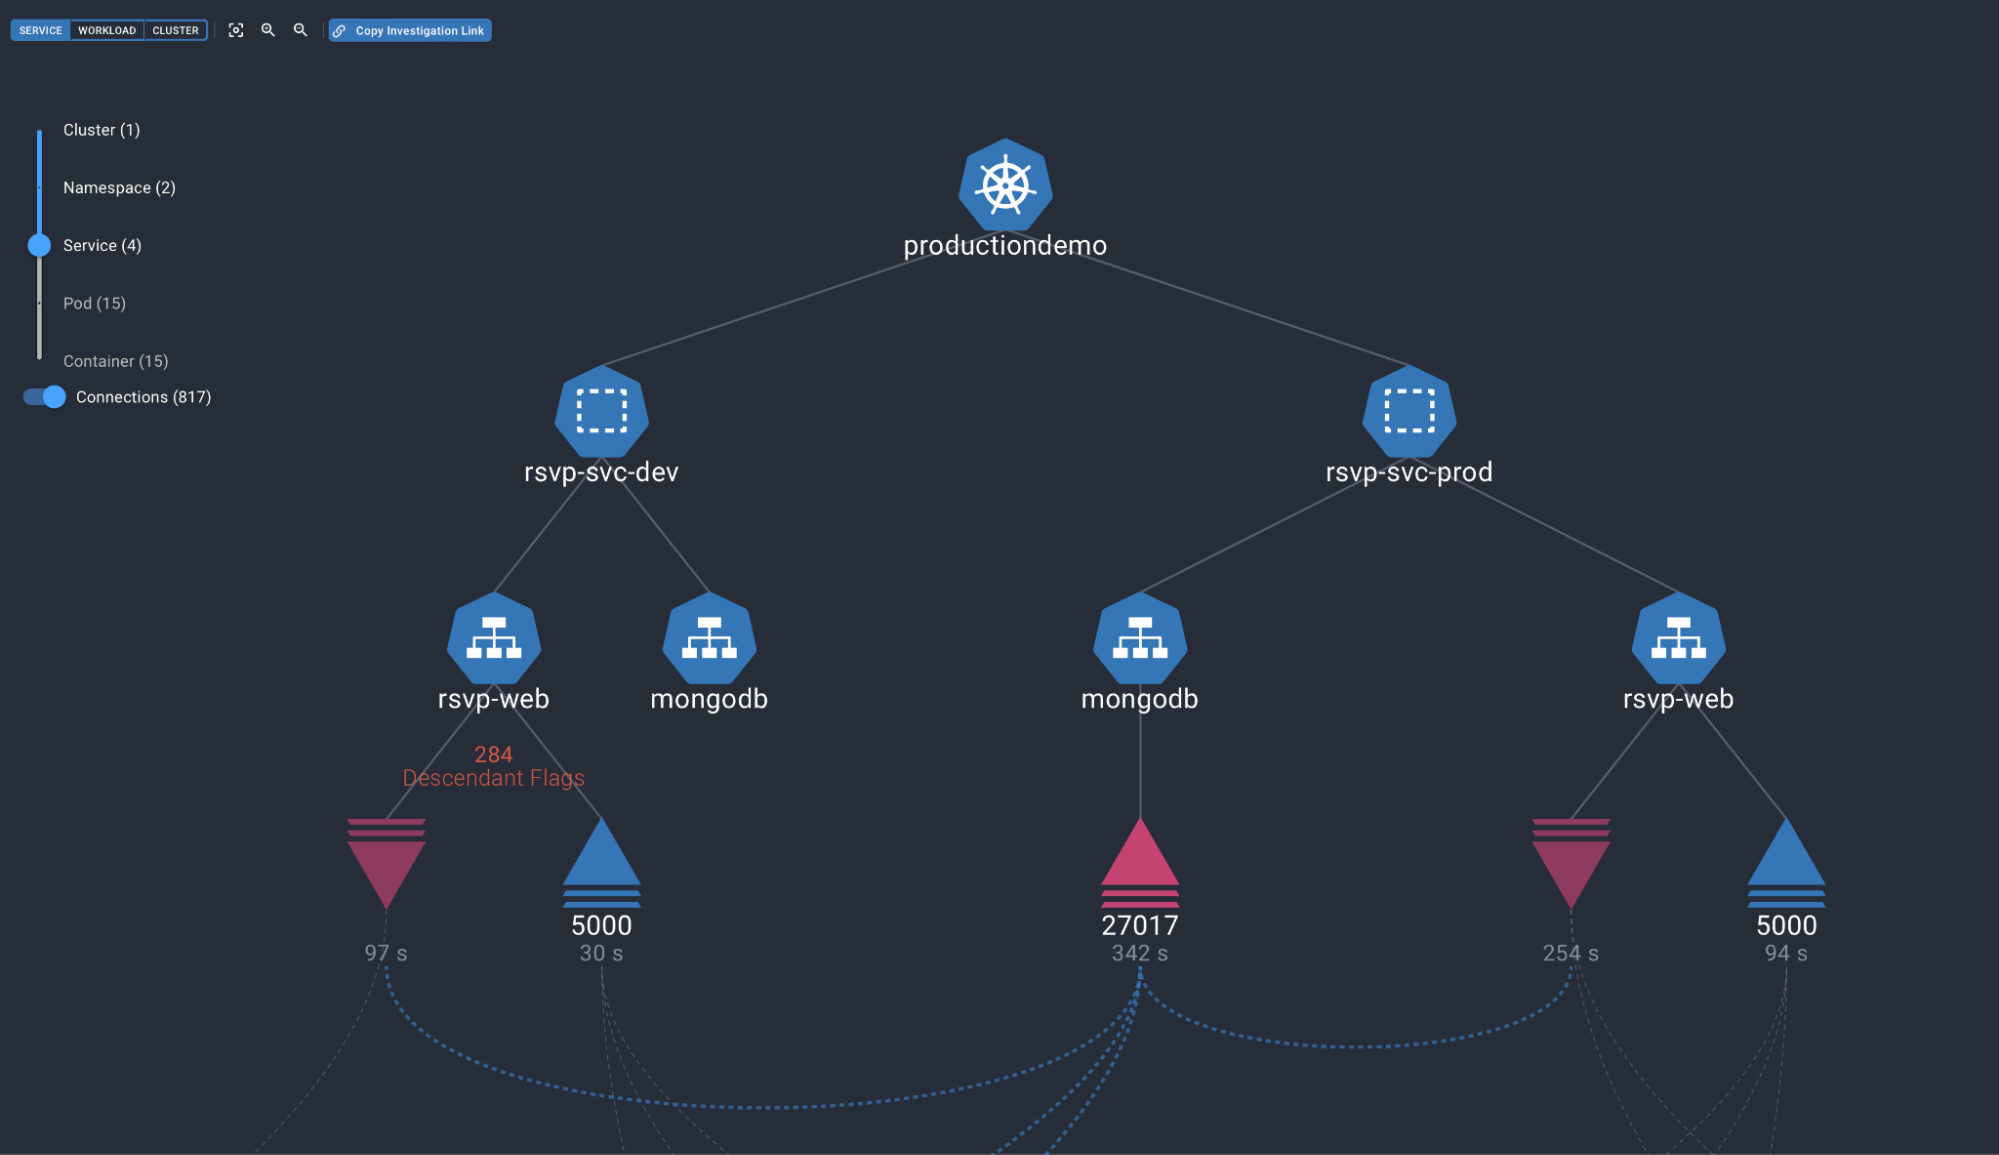
Dev (namespace) Web Server Talking to Prod (namespace) DB Might not be desired
- Network Policies
-
- This raises the question of how we can set network policy based on observation of network traffic. Armed with a thorough map of both observed “north-south” and “east-west” connections, we can intelligently program our network policies (e.g. K8s network policies, security groups etc…) without fear of missing something, or worse, shutting down a key dependency that our applications rely on at runtime. Paper exercises for dependency models like “threat modeling”, which are usually out of date before the ink has dried, can now be replaced with running the application in a pre-production environment and observing its actual behavior. Another concrete case where “runtime drives config time”.
A Quick Note on Service Meshes
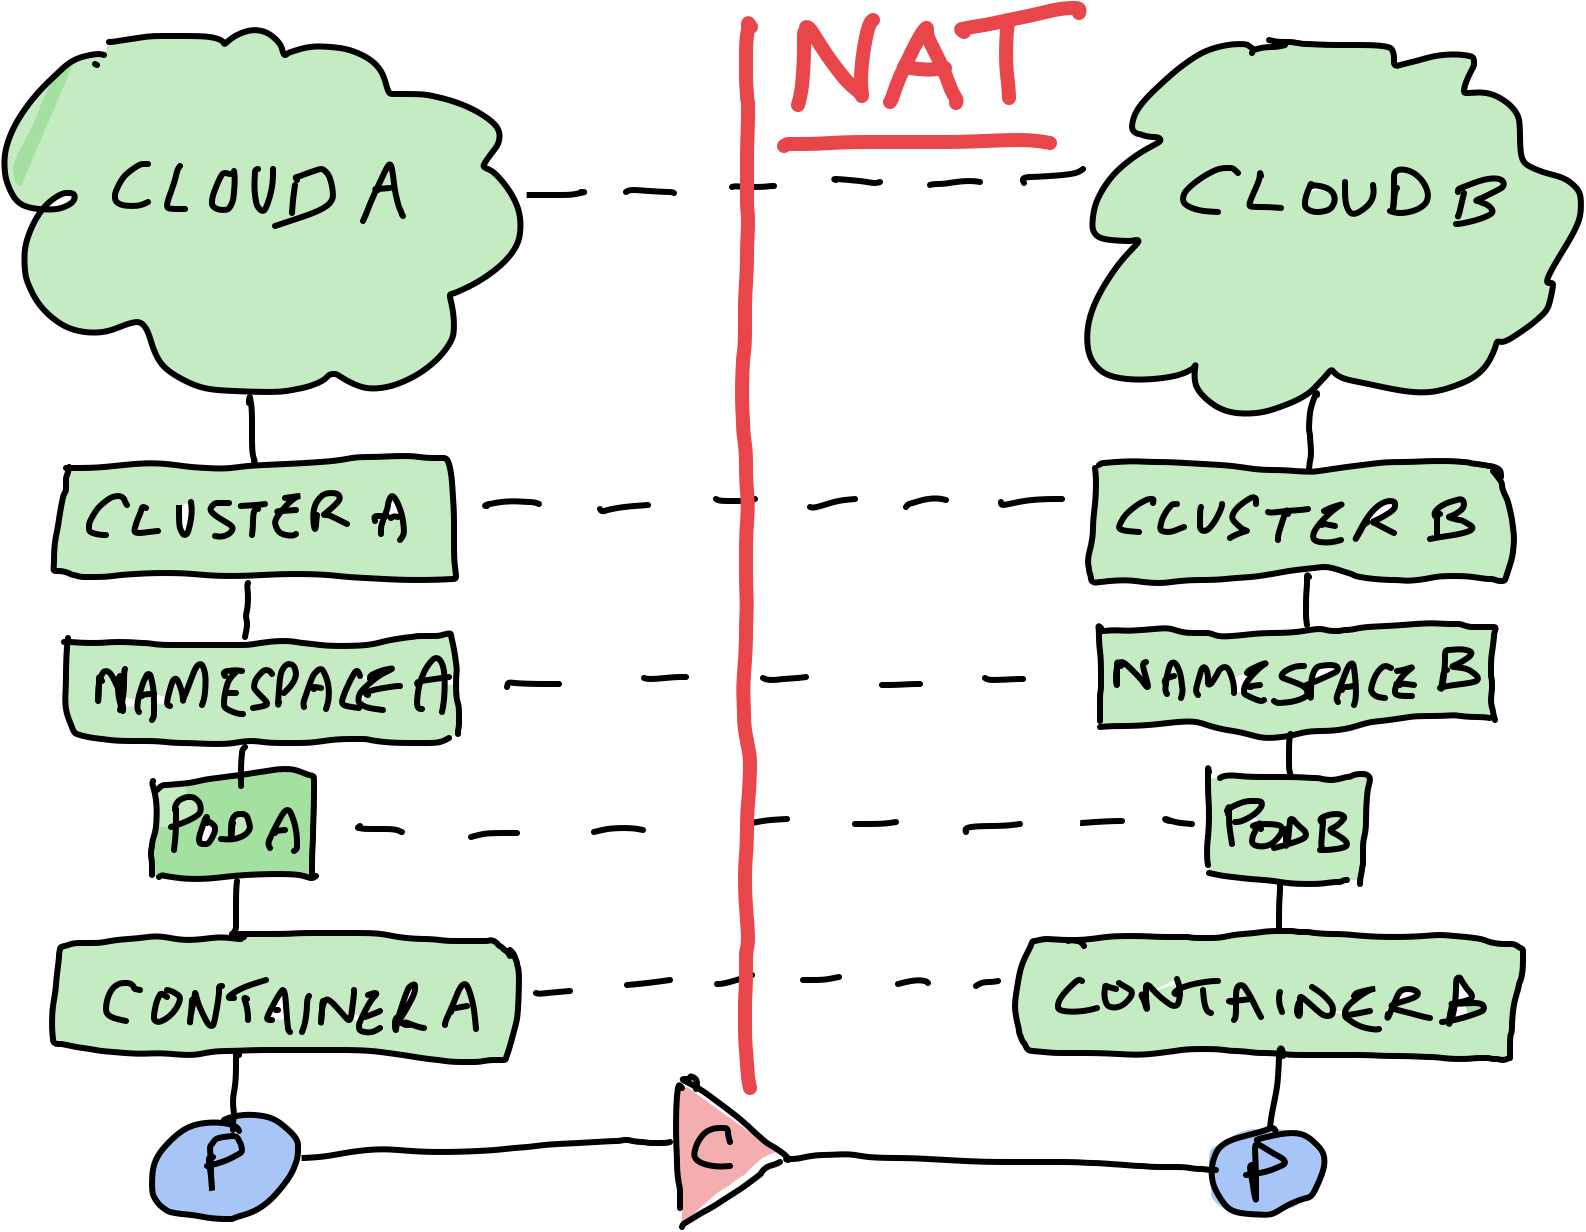
Service meshes have become the “Swiss Army Knife” of the Cloud Native world and can offer a lot of benefits, from securing the data plane traffic (e.g. mTLS between services) to observability, albeit with some overhead on the configuration and deployment side, especially in multi-Cluster or Cloud scenarios. Having said that, observability is somewhat limited, at least when leveraging a typical sidecar model. In the diagram below, for example, a Service Mesh will yield that there is a connection between App/Container A and App/Container B, but it does not tell us anything about the internal behavior of that application (processes etc..) or what process inside the container made the connection. It also doesn’t tell us anything about the activity happening outside the container itself - i.e. on the underlying node. For example, sidecar proxies can be bypassed - sometimes by design, which would of course yield no information on container to container traffic flows. Leveraging eBPF as described earlier, and putting the information in context, allows us to get complete visibility into what’s happening both inside and outside the container, and all of the connections between them. In a Service Mesh setup, for example, when using eBPF to “watch the watcher”, we can even observe which containers are not using the proxy. With the vantage point of eBPF both inside and outside the container, we also understand if container activity “spills over” into the underlying node itself, that is if someone escapes out of the container onto the node.

Sidecar vs eBPF for observability - “Watching the watcher”
Multi-Cluster and Multi-Cloud
Once we can stitch together network connections across arbitrary NAT mechanisms, and assuming we have eBPF based instrumentation running on both sides, we are not limited to a single cluster, but can now observe connections happening across multiple clusters or even clouds. For example, maybe we have our front end running in a K8s cluster on GCP, but those connections terminate on database VMs hosted in AWS. So long as we have an eBPF instrumentation running on both sides, we observe those connections, and their associated (K8s and cloud) context. Now we can answer questions like:
- What are all the workloads that are communicating across clusters?
- How about across clouds?
Should there even be cluster to cluster or cloud to cloud network connections happening at all? DoorDash for example, in their article, reference a really interesting use case about how they leveraged eBPF to track down “hairpinning”. This is where internal folks were calling the DoorDash APIs, but traffic was going out to the public internet and coming back in again, representing an opportunity for further optimization.
Spyderbat Guardian
Once we have a real handle on the actual detailed behavior of our workloads, their network dependencies (both “north-south” and “east-west”) and how it all ties together, we can (automatically) build accurate and detailed behavior profiles for our workloads. At Spyderbat, we call this capability “Guardian”, and it allows us to effectively put “Guardrails” around the observed behaviors of our workloads, letting us know when runtime behaviors go outside of those Guardrails, and even driving automated responses if desired. For example, a container starts to execute processes with different permissions than observed previously, or a container or VM starts to exhibit new (upstream or downstream) network dependencies that we haven’t seen before. In a sense, it’s the logical conclusion of “observing runtime to inform config time” we talked about earlier. And it goes beyond detecting and responding to security issues (although it’s very powerful for that) - new code is being written and deployed all the time, referencing all kinds of packages, libraries and 3rd party dependencies. It’s impossible to understand all the effects of changing code a priori without actually running it. The same exact code deployed into two different environments can exhibit completely different runtime behaviors. The proof is in the pudding as it were, and using eBPF coupled with the appropriate context gives us this proof.
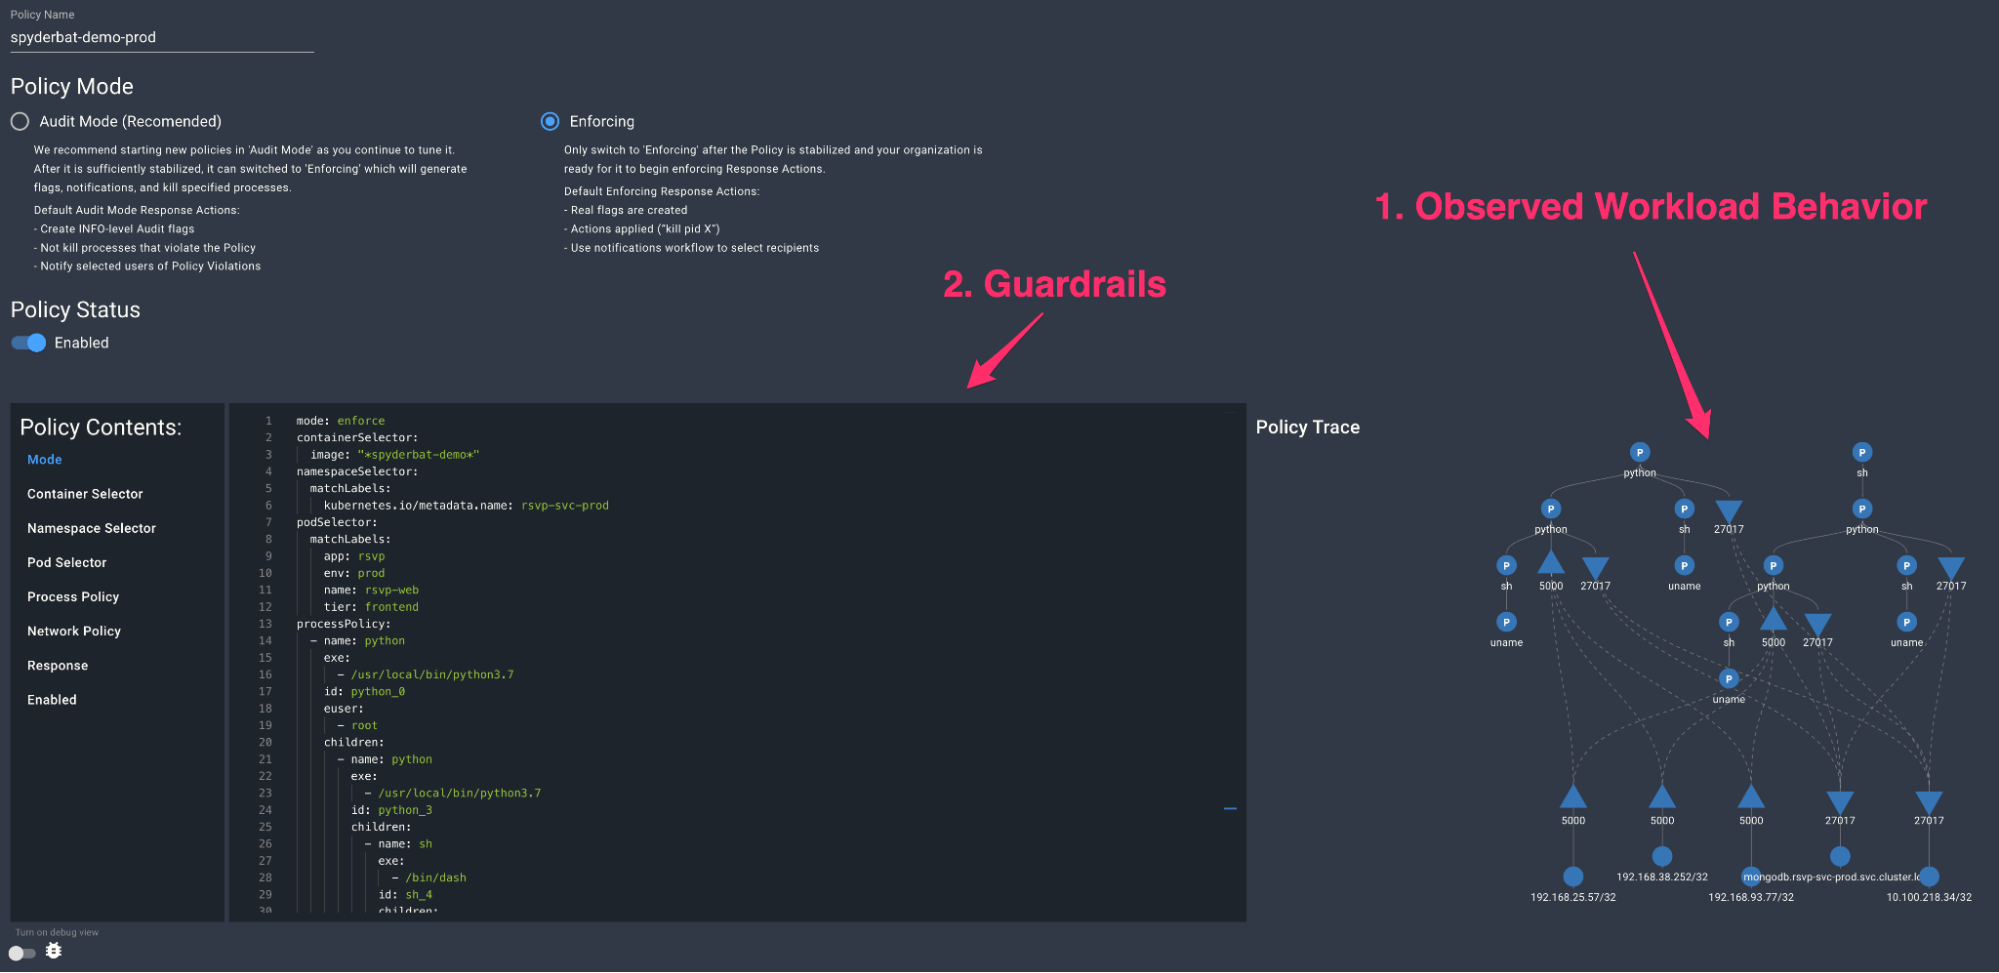
Spyderbat Guardian
Summary
In this blog, we’ve explored how eBPF can be leveraged to observe network behavior in new ways and tie it back to behavior inside the workload itself. This unlocks a wealth of granular new insights and use cases. Fundamental to the approach is using these runtime observations for a data driven method to drive more efficient and secure Cloud and infrastructure configurations, and drive feedback loops from runtime back to config time.
For more detail on how eBPF can provide the context that teams need to understand deployments, prioritize updates, or stop threats, check out our detailed eBPF whitepaper
Want to see Spyderbat in action?

