


Want to see Spyderbat in action?


One consistent theme we’ve heard from customers is how hard it is to tie network activity (and security alerts) back to the workload (and underlying process) that is generating them. There are a couple of reasons for this:
- The network activity/alerts often don’t have sufficient context to tie them back to the workload activity in question, and
- The application or workload that generated the alerts in question may no longer be around by the time we start to investigate it.
This last point is particularly true in Cloud Native and Kubernetes environments. For example, in Amazon EKS, not only are the container and pod workloads themselves ephemeral, but the underlying nodes are too, especially in environments leveraging Kubernetes Autoscaling to scale the Cluster up and down dynamically in response to load demands.
Let’s take a look at some DNS network based alerts in AWS GuardDuty as an example.
AWS GuardDuty
GuardDuty is a service offered by AWS for threat detection in AWS environments. Many of the detections leverage VPC Flow Logs to surface network based detections. In this walk through, we’ll be leveraging the GuardDuty tester available on Github here, to generate three different types of DNS alerts (or “findings”). Note - findings can take some time to surface in the AWS Console after they’re triggered (at least 30 mins+ in our testing). This latency reinforces point 2 above: the container or even underlying node could well be gone by the time you receive one of these findings.
Backdoor:EC2/C&CActivity.B!DNS
This particular GuardDuty finding tells you that a particular AWS instance is querying a DNS domain name associated with a known command and control (C&C or “C2”) server. To create an example alert here, we do a “kubectl exec” into one of the pods in our EKS environment, and execute a dig GuardDutyC2ActivityB.com any per the Github repo instructions. After waiting a while for the finding to show up, we get a finding similar to this:
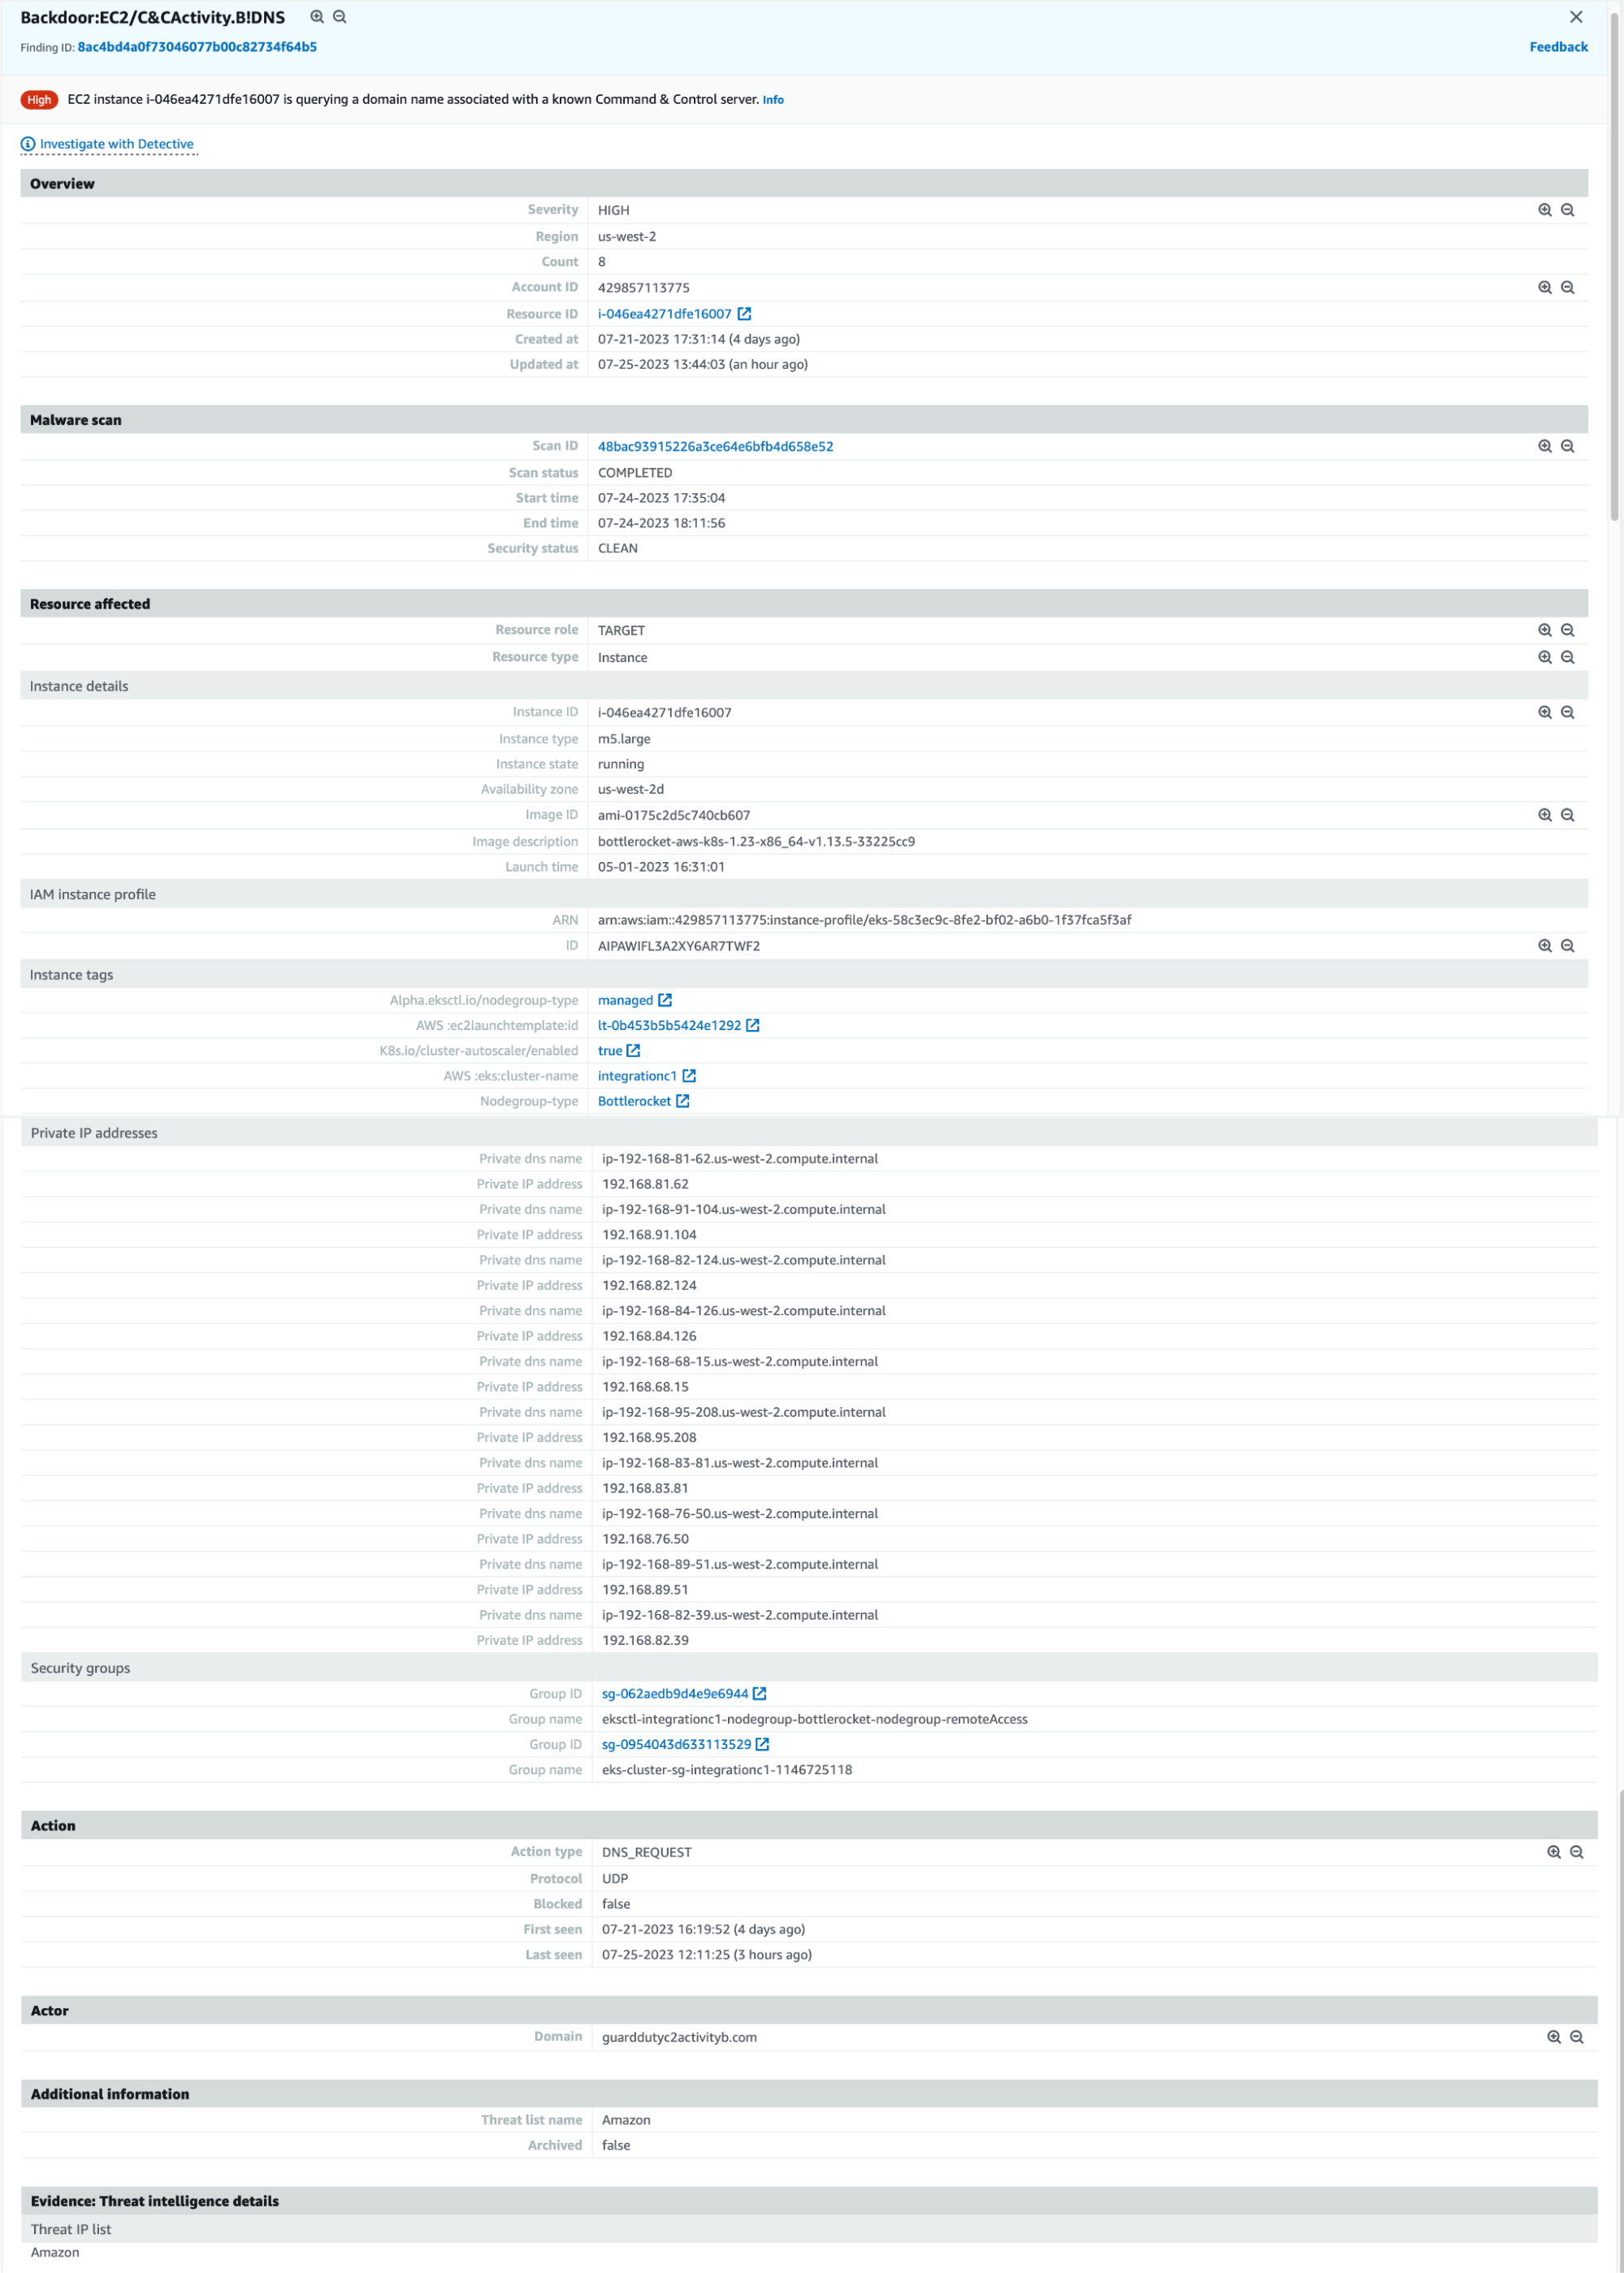
AWS GuardDuty Command and Control DNS Finding
The finding specifies several important pieces of information:
- The AWS instance ID that generated the request.
- EKS Cluster metadata.
- The network interface and IP address information for the host machine
- A timestamp (or timestamp range for multiple findings) associated with the finding.
- An “Actor” section that lists the suspicious DNS domain being queried.
Note that it does not contain anything to identify the container or pod that queried the domain. Although we have a detection, we’re no closer to understanding the actual container or process that made this DNS call. Worse, since the finding showed up 30 mins+ later, there’s a significant chance the container and possibly even the node is no longer around.
Before we show this particular scenario in Spyderbat, let’s step back a bit. The conventional approach is to receive an alert like this and try to work backwards to build context in order to figure out what happened. What if we could capture the important information via eBPF and other sources, up front, and build that context all the time (going back at least 90 days by default, and not just the last few seconds of activity stored in a ring buffer etc…)? We’d always have the information available when we needed it - even if the containers or nodes are long gone (turns out having this continuous context available is also a game changer for detections as well, but more on that in other blog posts). It would be a bit like playing the classic board game “Clue” (or “Cluedo” for my UK friends 🙂) - but someone slipped you a card at the start of the game - “it was Mrs Peacock, in the study, with the candlestick”!
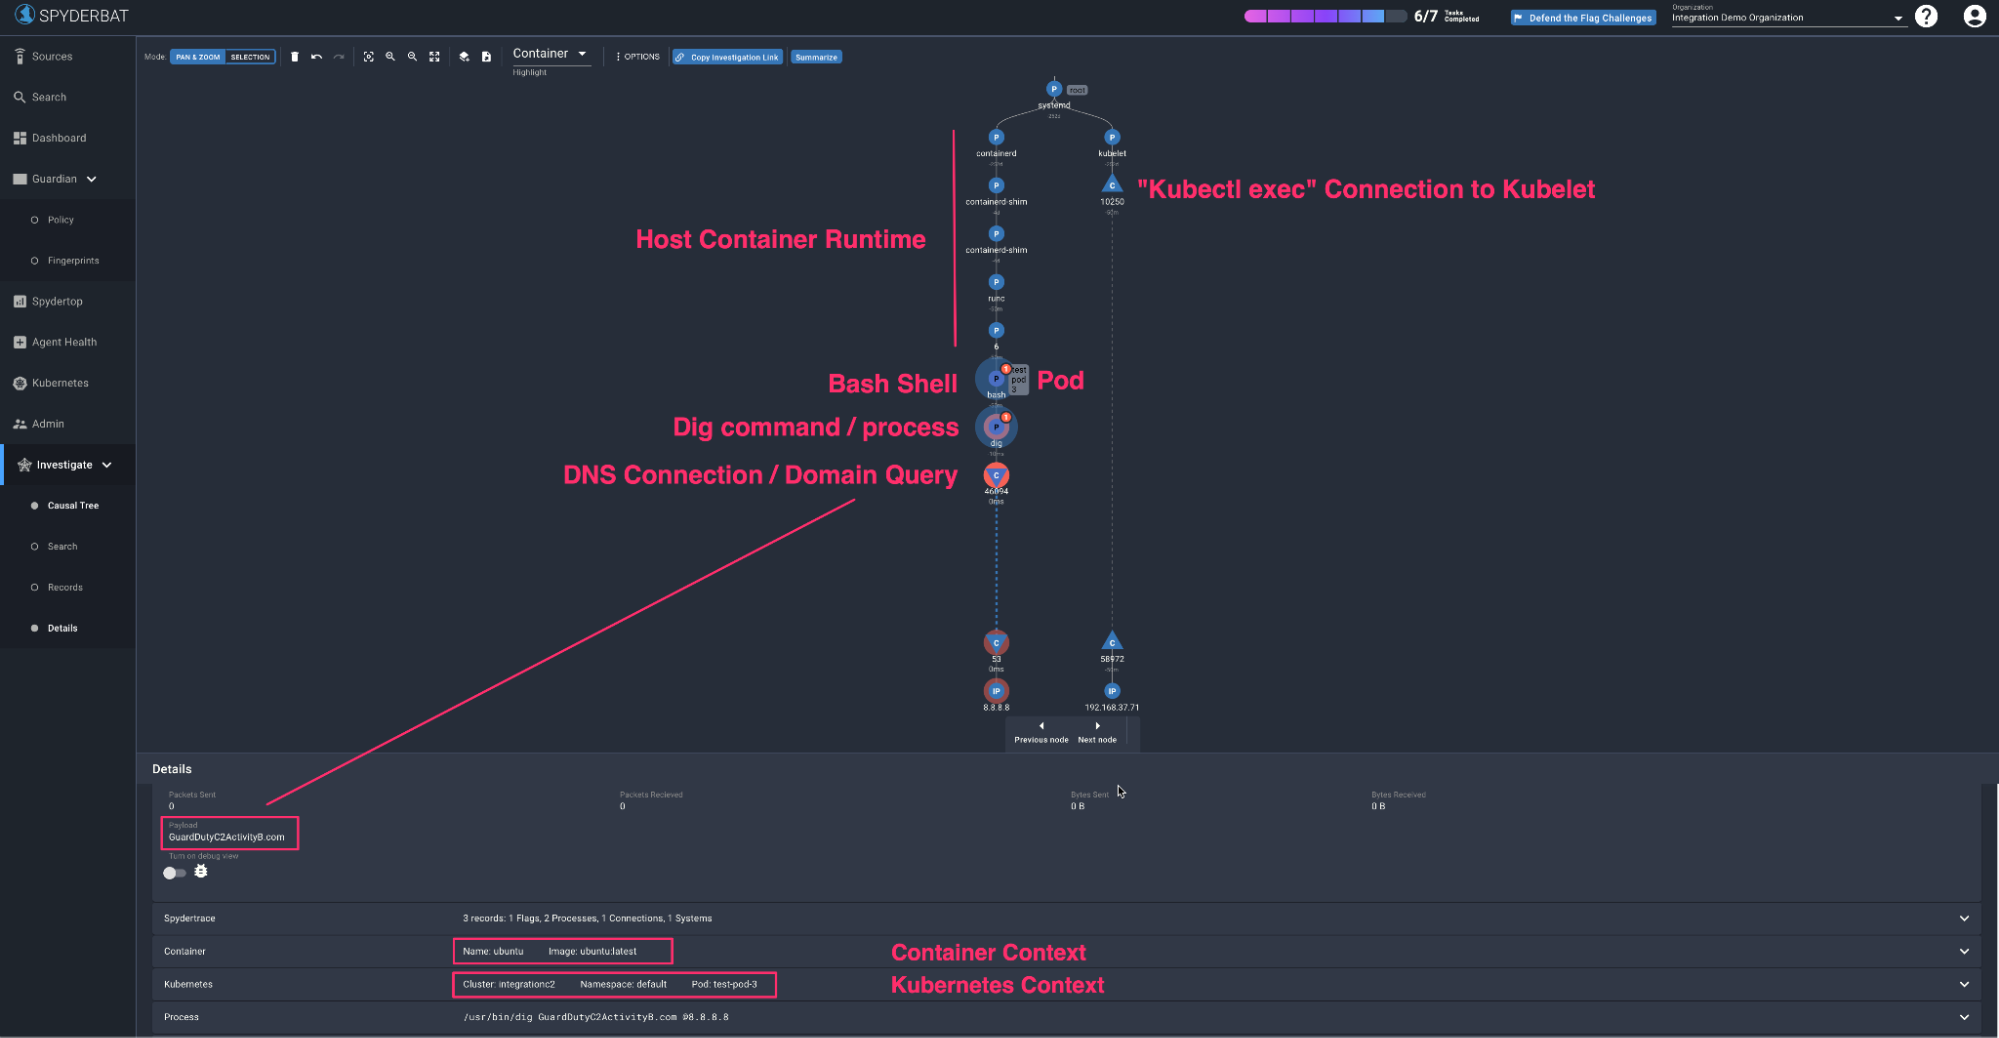
DNS Domain Query to Command and Control Server
Let’s take a look at this scenario in Spyderbat. What you’re looking at here is a Spyderbat “trace” of activity - basically the sequence of activities inside the container/workload and it’s network activity tied together - the contextual video recording essentially we described above. The trace can be read in time by going from the top to bottom and left to right. Here we can see the dig process (the command we executed above) and the resulting DNS connection this process made to the DNS server inside the cluster. And we know the container (and the image it came from) this process is running inside, the pod that container is part of, the namespace that pod is in, the cluster the namespace is in and so on - context all the way down. The context doesn’t stop there either - we can see that a bash shell (resulting from a “Kubectl exec”) where the dig command was executed from, we can even see the connection from the API server into the Kubelet that started the shell, and the container runtime on the underlying host that started the container in the first place! You can see we’ve highlighted the DNS connection in this screenshot, and there’s a field called “payload” - in this instance, the payload field captures the domain that is being queried by the DNS connection - that is - GuardDutyC2ActivityB.com - the domain we queried in our dig command previously and that we saw in the GuardDuty finding.
Great - so how did we get here in the 1st place; what’s the workflow? In addition to capturing this “context recording” (by default for the last 90 days) - we also index this information so it’s searchable. So in the GuardDuty case, we can simply search for connections with a payload of GuardDutyC2ActivityB.com (which appeared in the GuardDuty finding). This search will bring back any (DNS) connections that have queried for that domain name - and from there the full context is a click away. We can qualify the search with the timeframe of interest or even hone down to a particular instance (id) - but if we see a domain query like this - better to search across the fleet and understand all of the workloads that may have interacted with it.
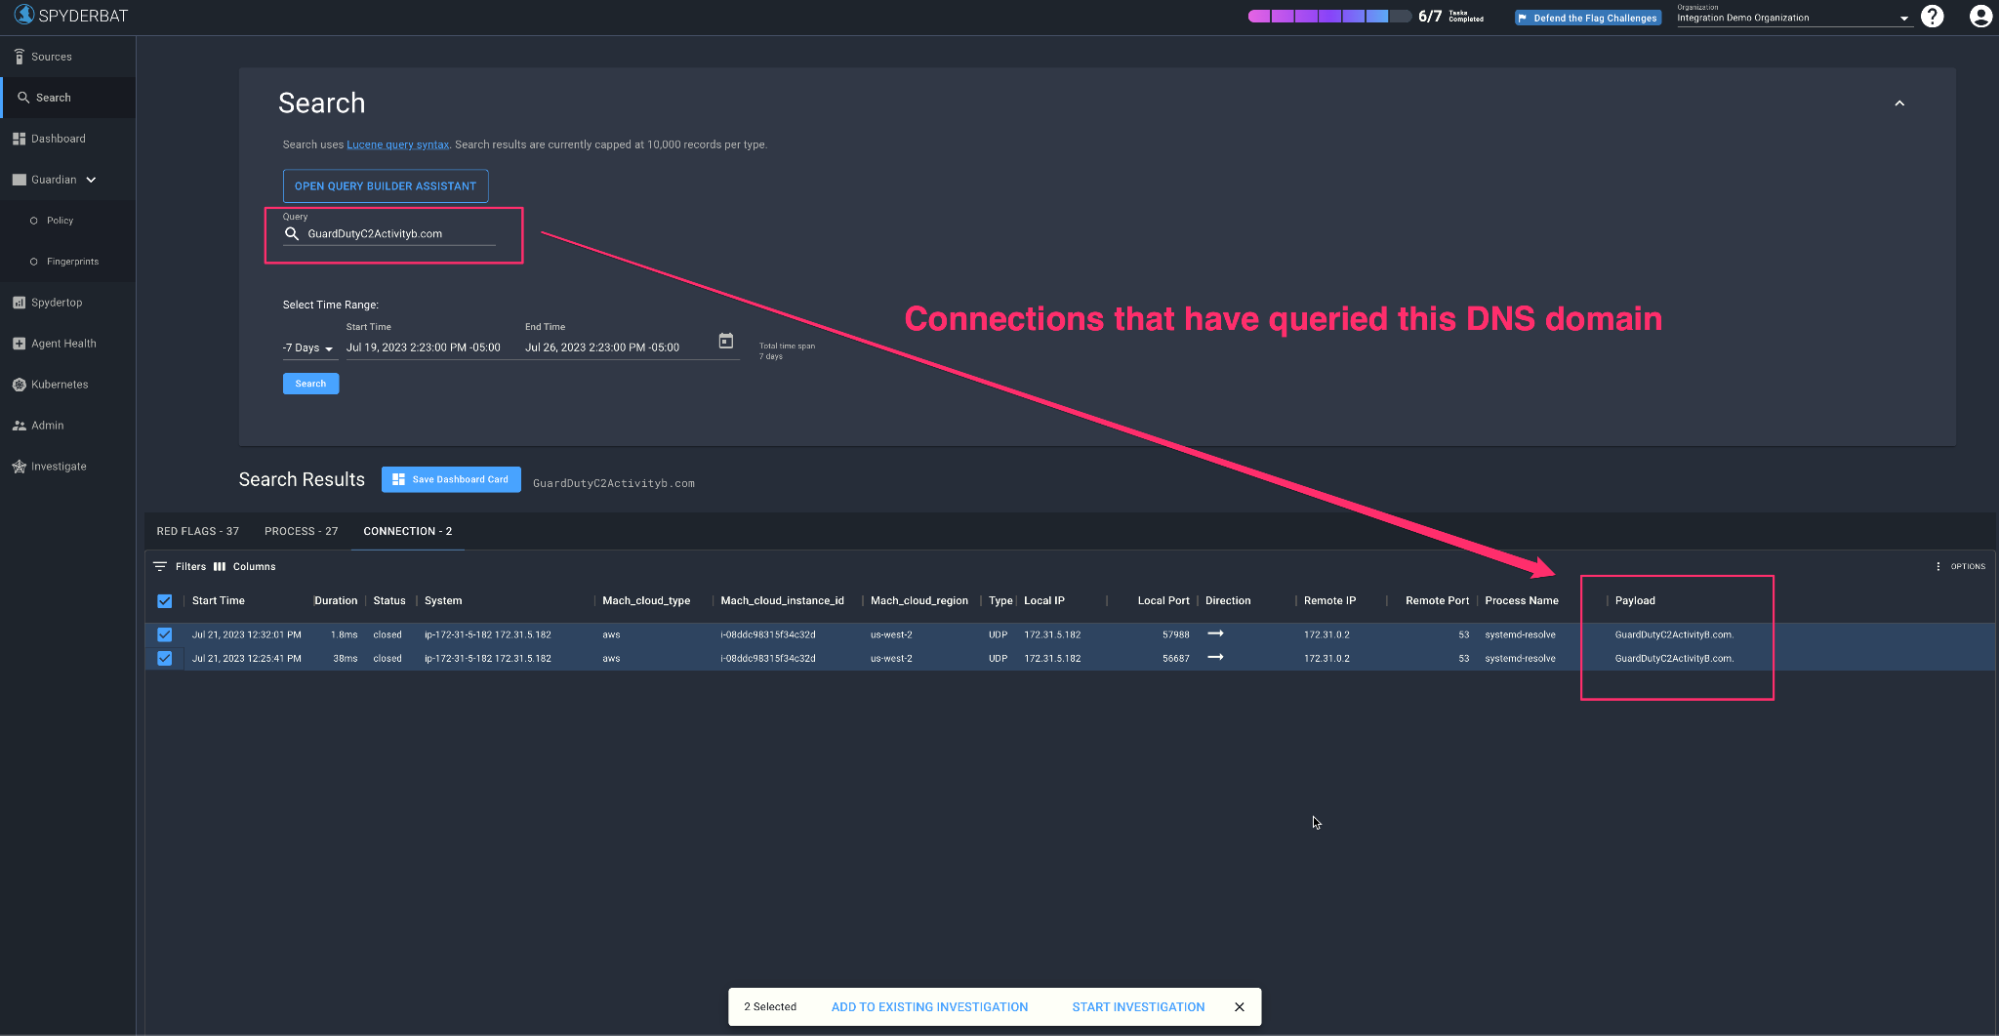
Instantly find connections that have queried for the bad domain
CryptoCurrency:EC2/BitcoinTool.B!DNS
Let’s take a look at another example from GuardDuty - this finding tells you the EC2 instance that is querying a domain name associated with Bitcoin or other cryptocurrency-related activity. In the Github repo from earlier, we can see a way to trigger this finding by running:
echo "Calling bitcoin wallets to download mining toolkits"

curl -s http://pool.minergate.com/dkjdjkjdlsajdkljalsskajdksakjdksajkllalkdjsalkjdsalkjdlkasj  > /dev/null &

curl -s http://xmr.pool.minergate.com/dhdhjkhdjkhdjkhajkhdjskahhjkhjkahdsjkakjasdhkjahdjk  > /dev/null &
After allowing for the obligatory waiting period, we see a finding show up in GuardDuty like follows:
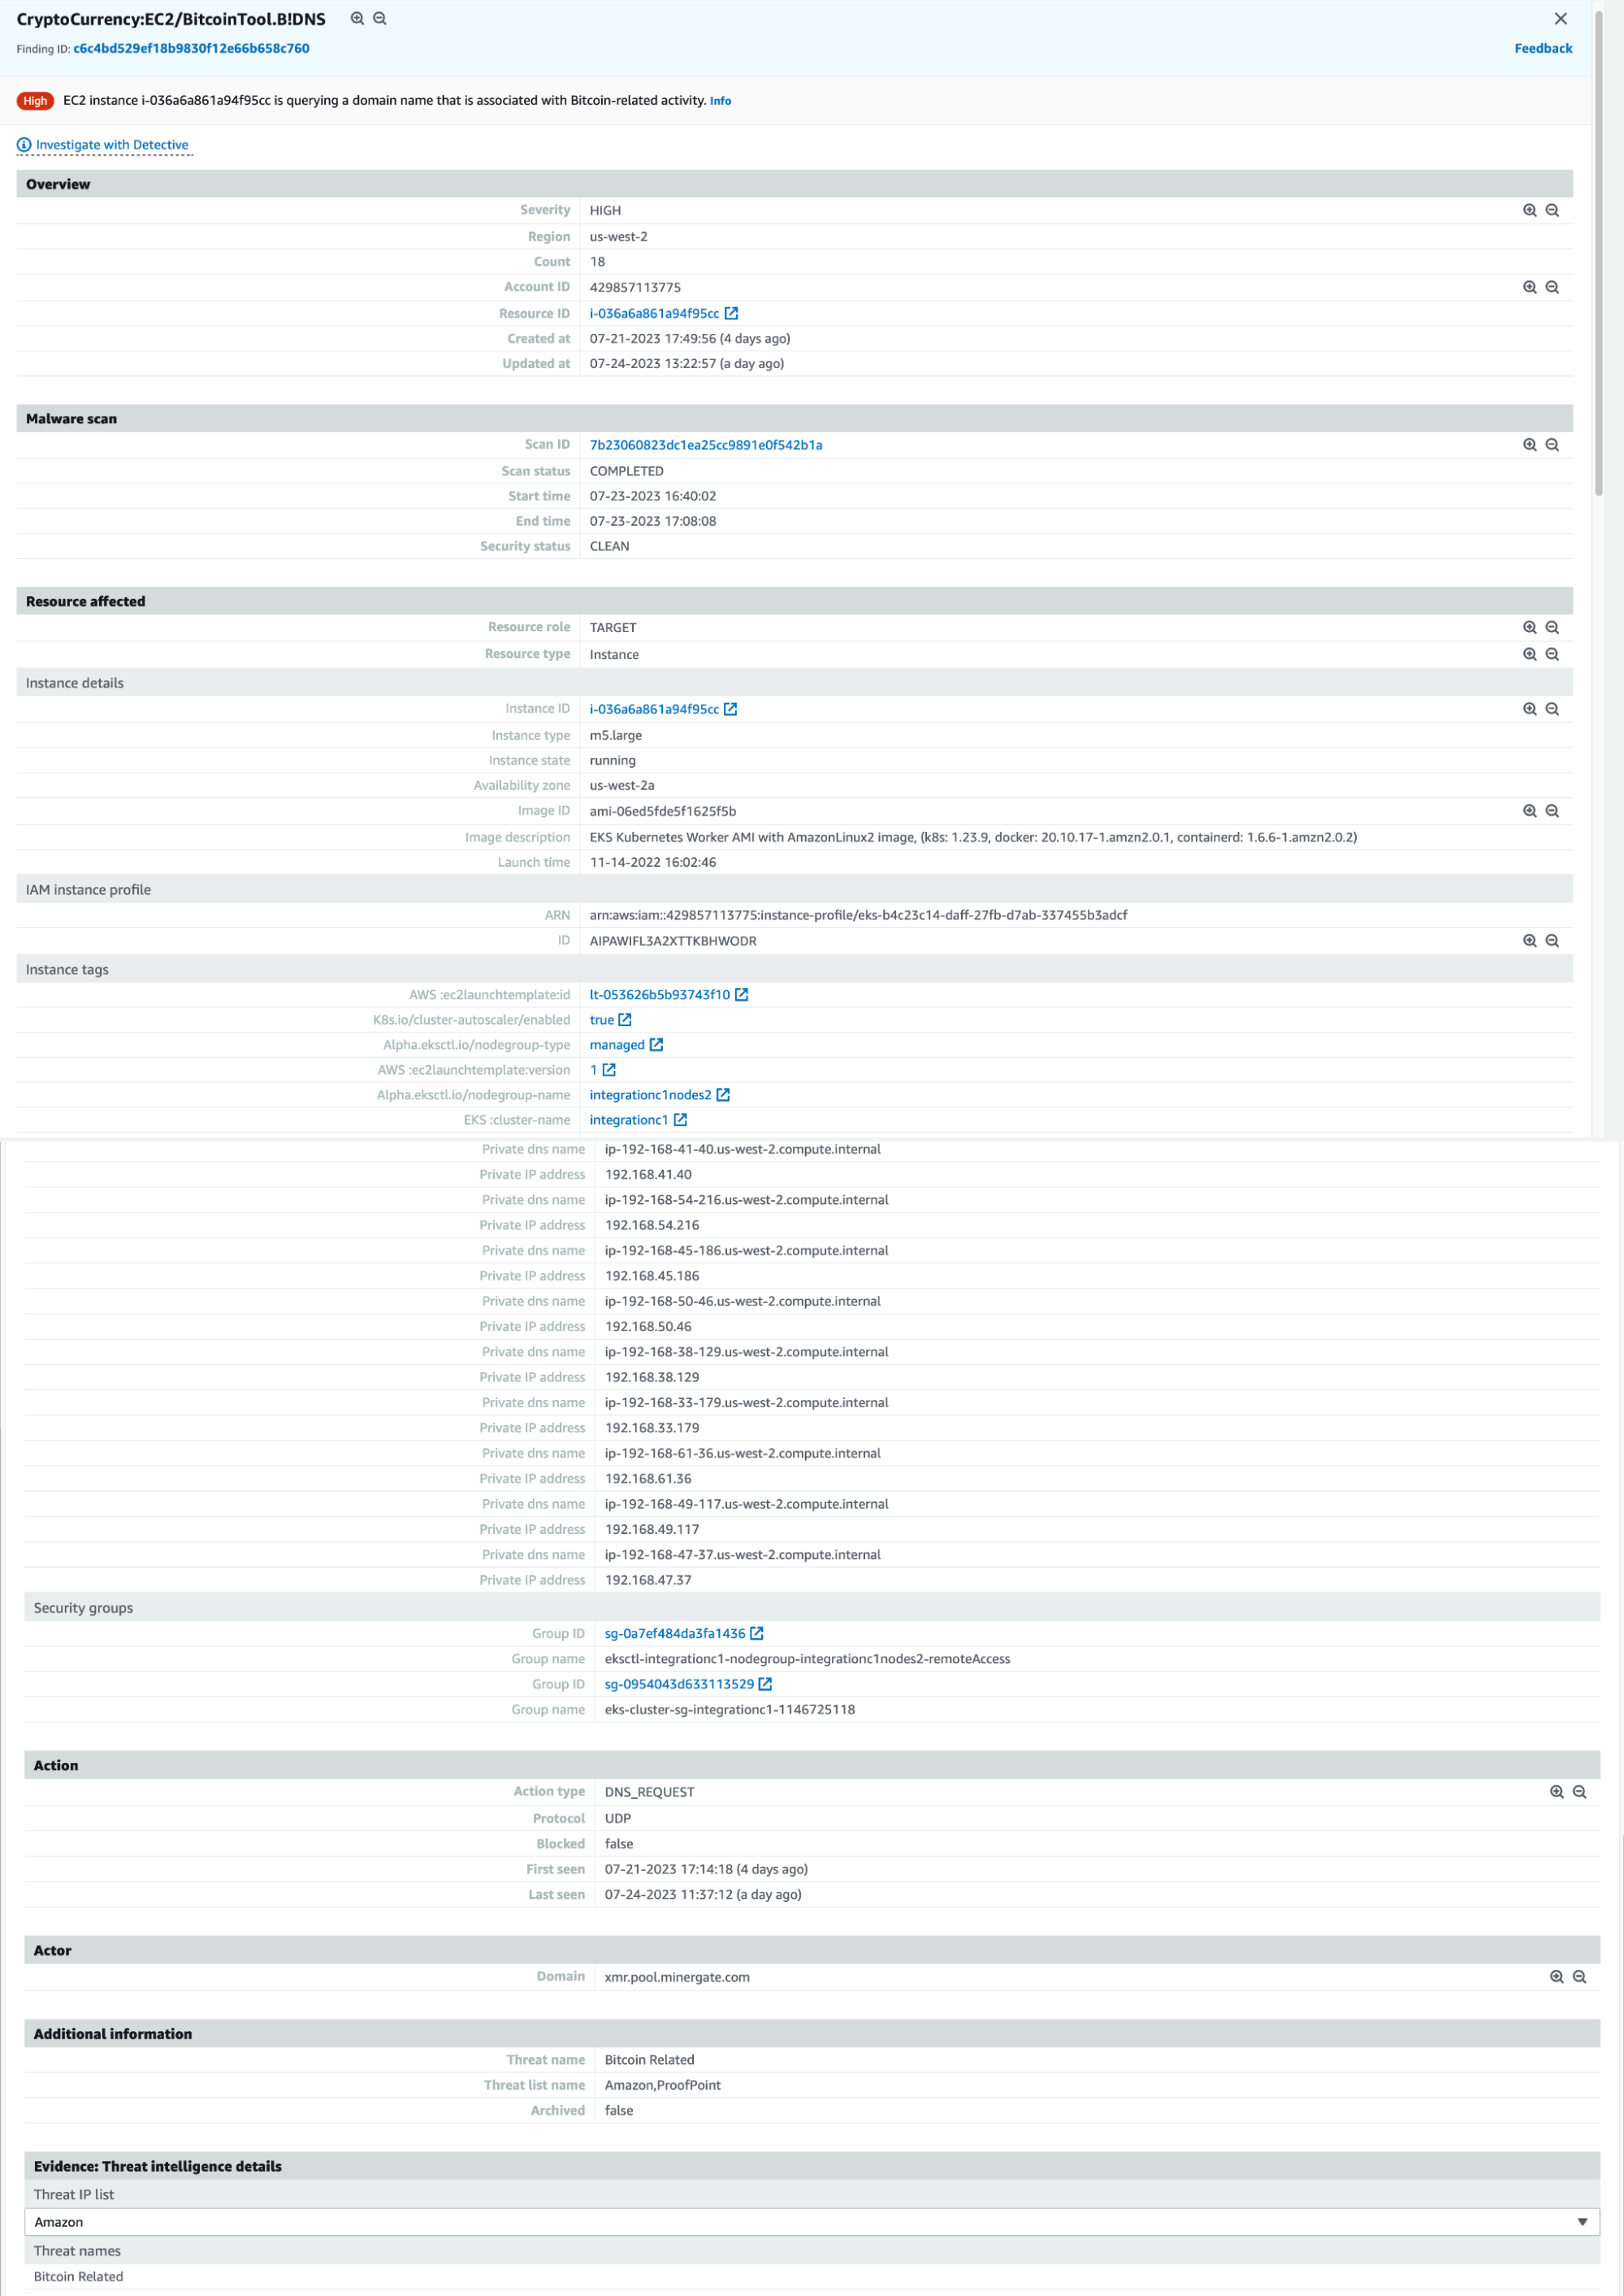
AWS GuardDuty CryptoCurrency DNS Finding
You’ll notice that this finding looks almost identical to the previous one, basic EC2 instance info, EKS Cluster metadata (but again no container info), and the specific DNS domain that has been queried by one of our workloads on this instance. And here’s what it looks like in Spyderbat:
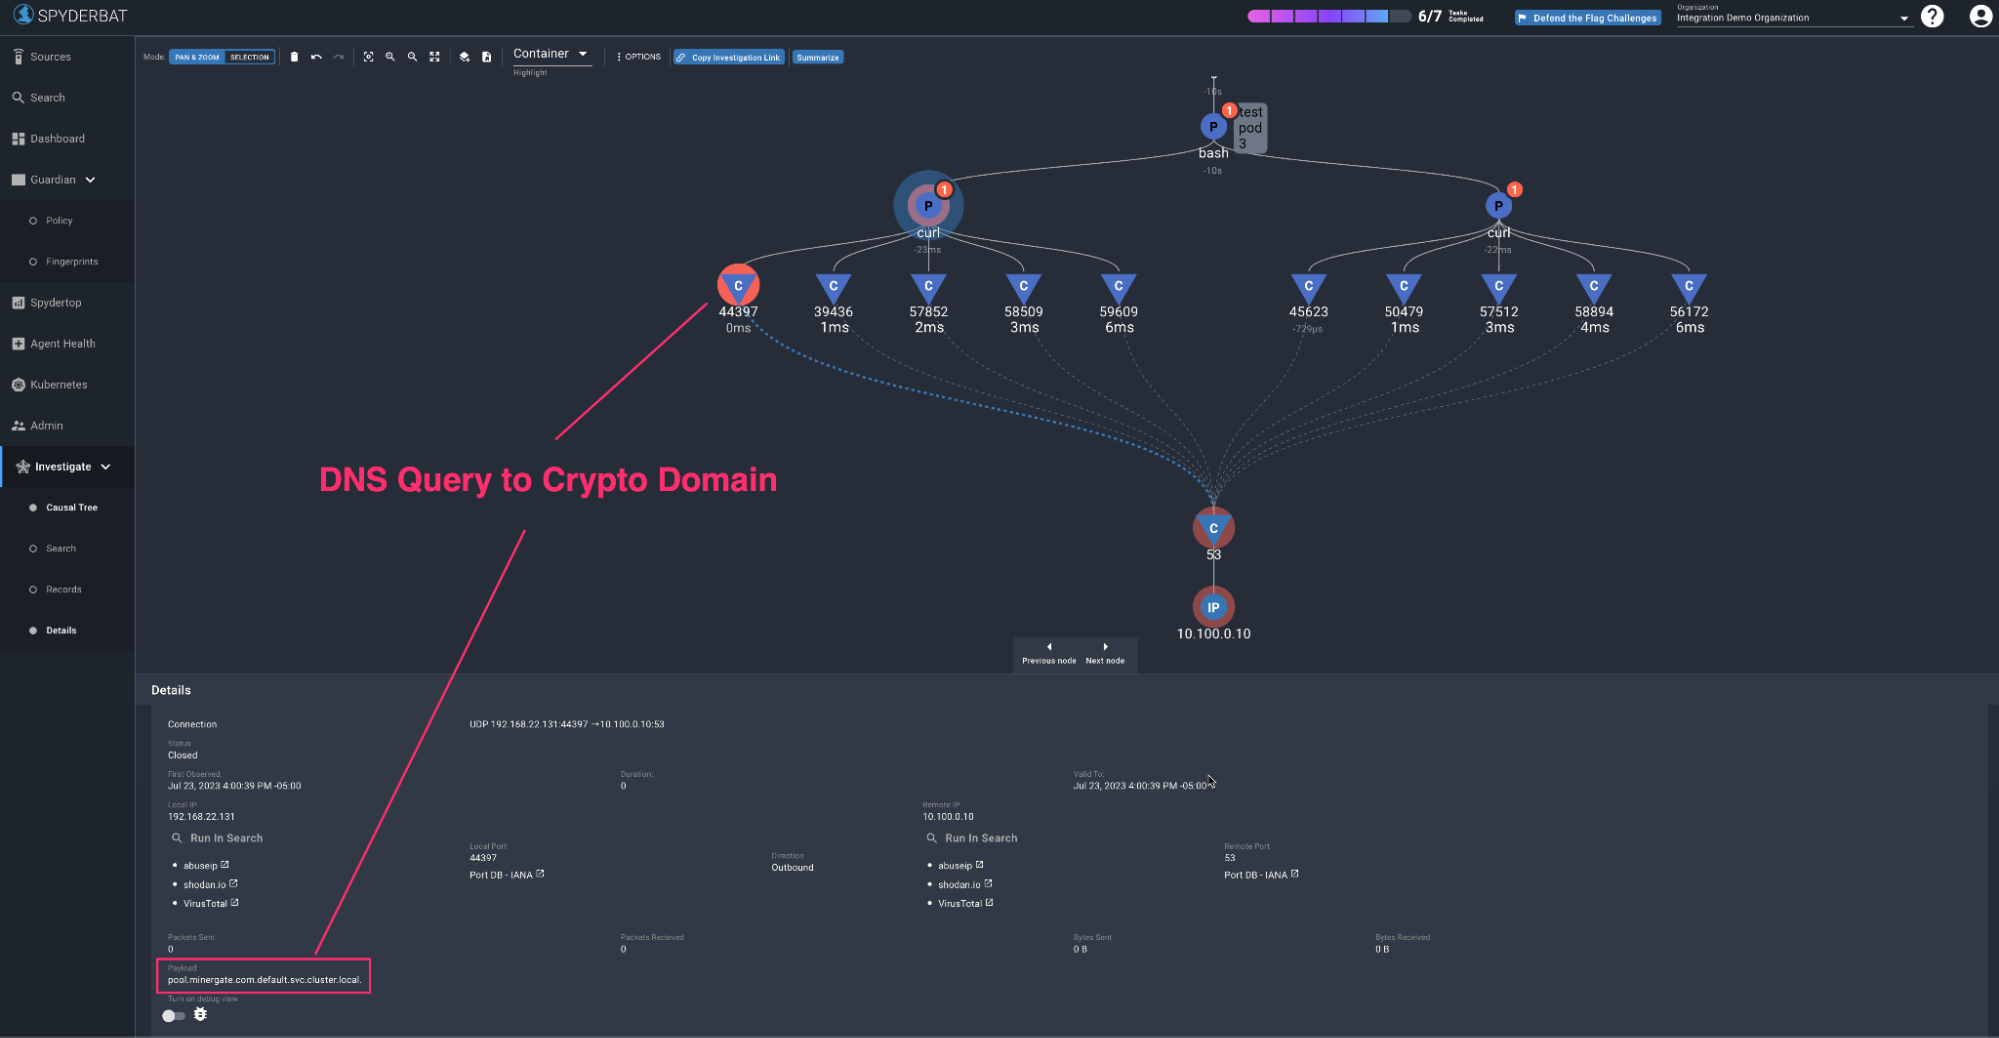
Curl Commands to Cryptominer Domains
We again get the full context of the shell inside the container, the two Curl commands being run and their resulting connections - the payload field on the DNS connections or the domain being queried, is captured as pool.minergate.com and xmr.pool.minergate.com respectively, and we can again find the culprit workloads instantly by searching for these domains in search.
Trojan:EC2/DNSDataExfiltration
Last one in our test suite - this finding tells you that there’s a whole bunch of DNS queries happening that could be indicative of data exfiltration via DNS. To test this, we again follow the Github repo instructions and run:
dig -f ./domains/queries.txt > /dev/null &
Where queries.txt is a list of 900+ domains that get queried to simulate tunneling via DNS. GuardDuty doesn't report all 930 findings, but we get some, and the findings are similar to the previous two types:
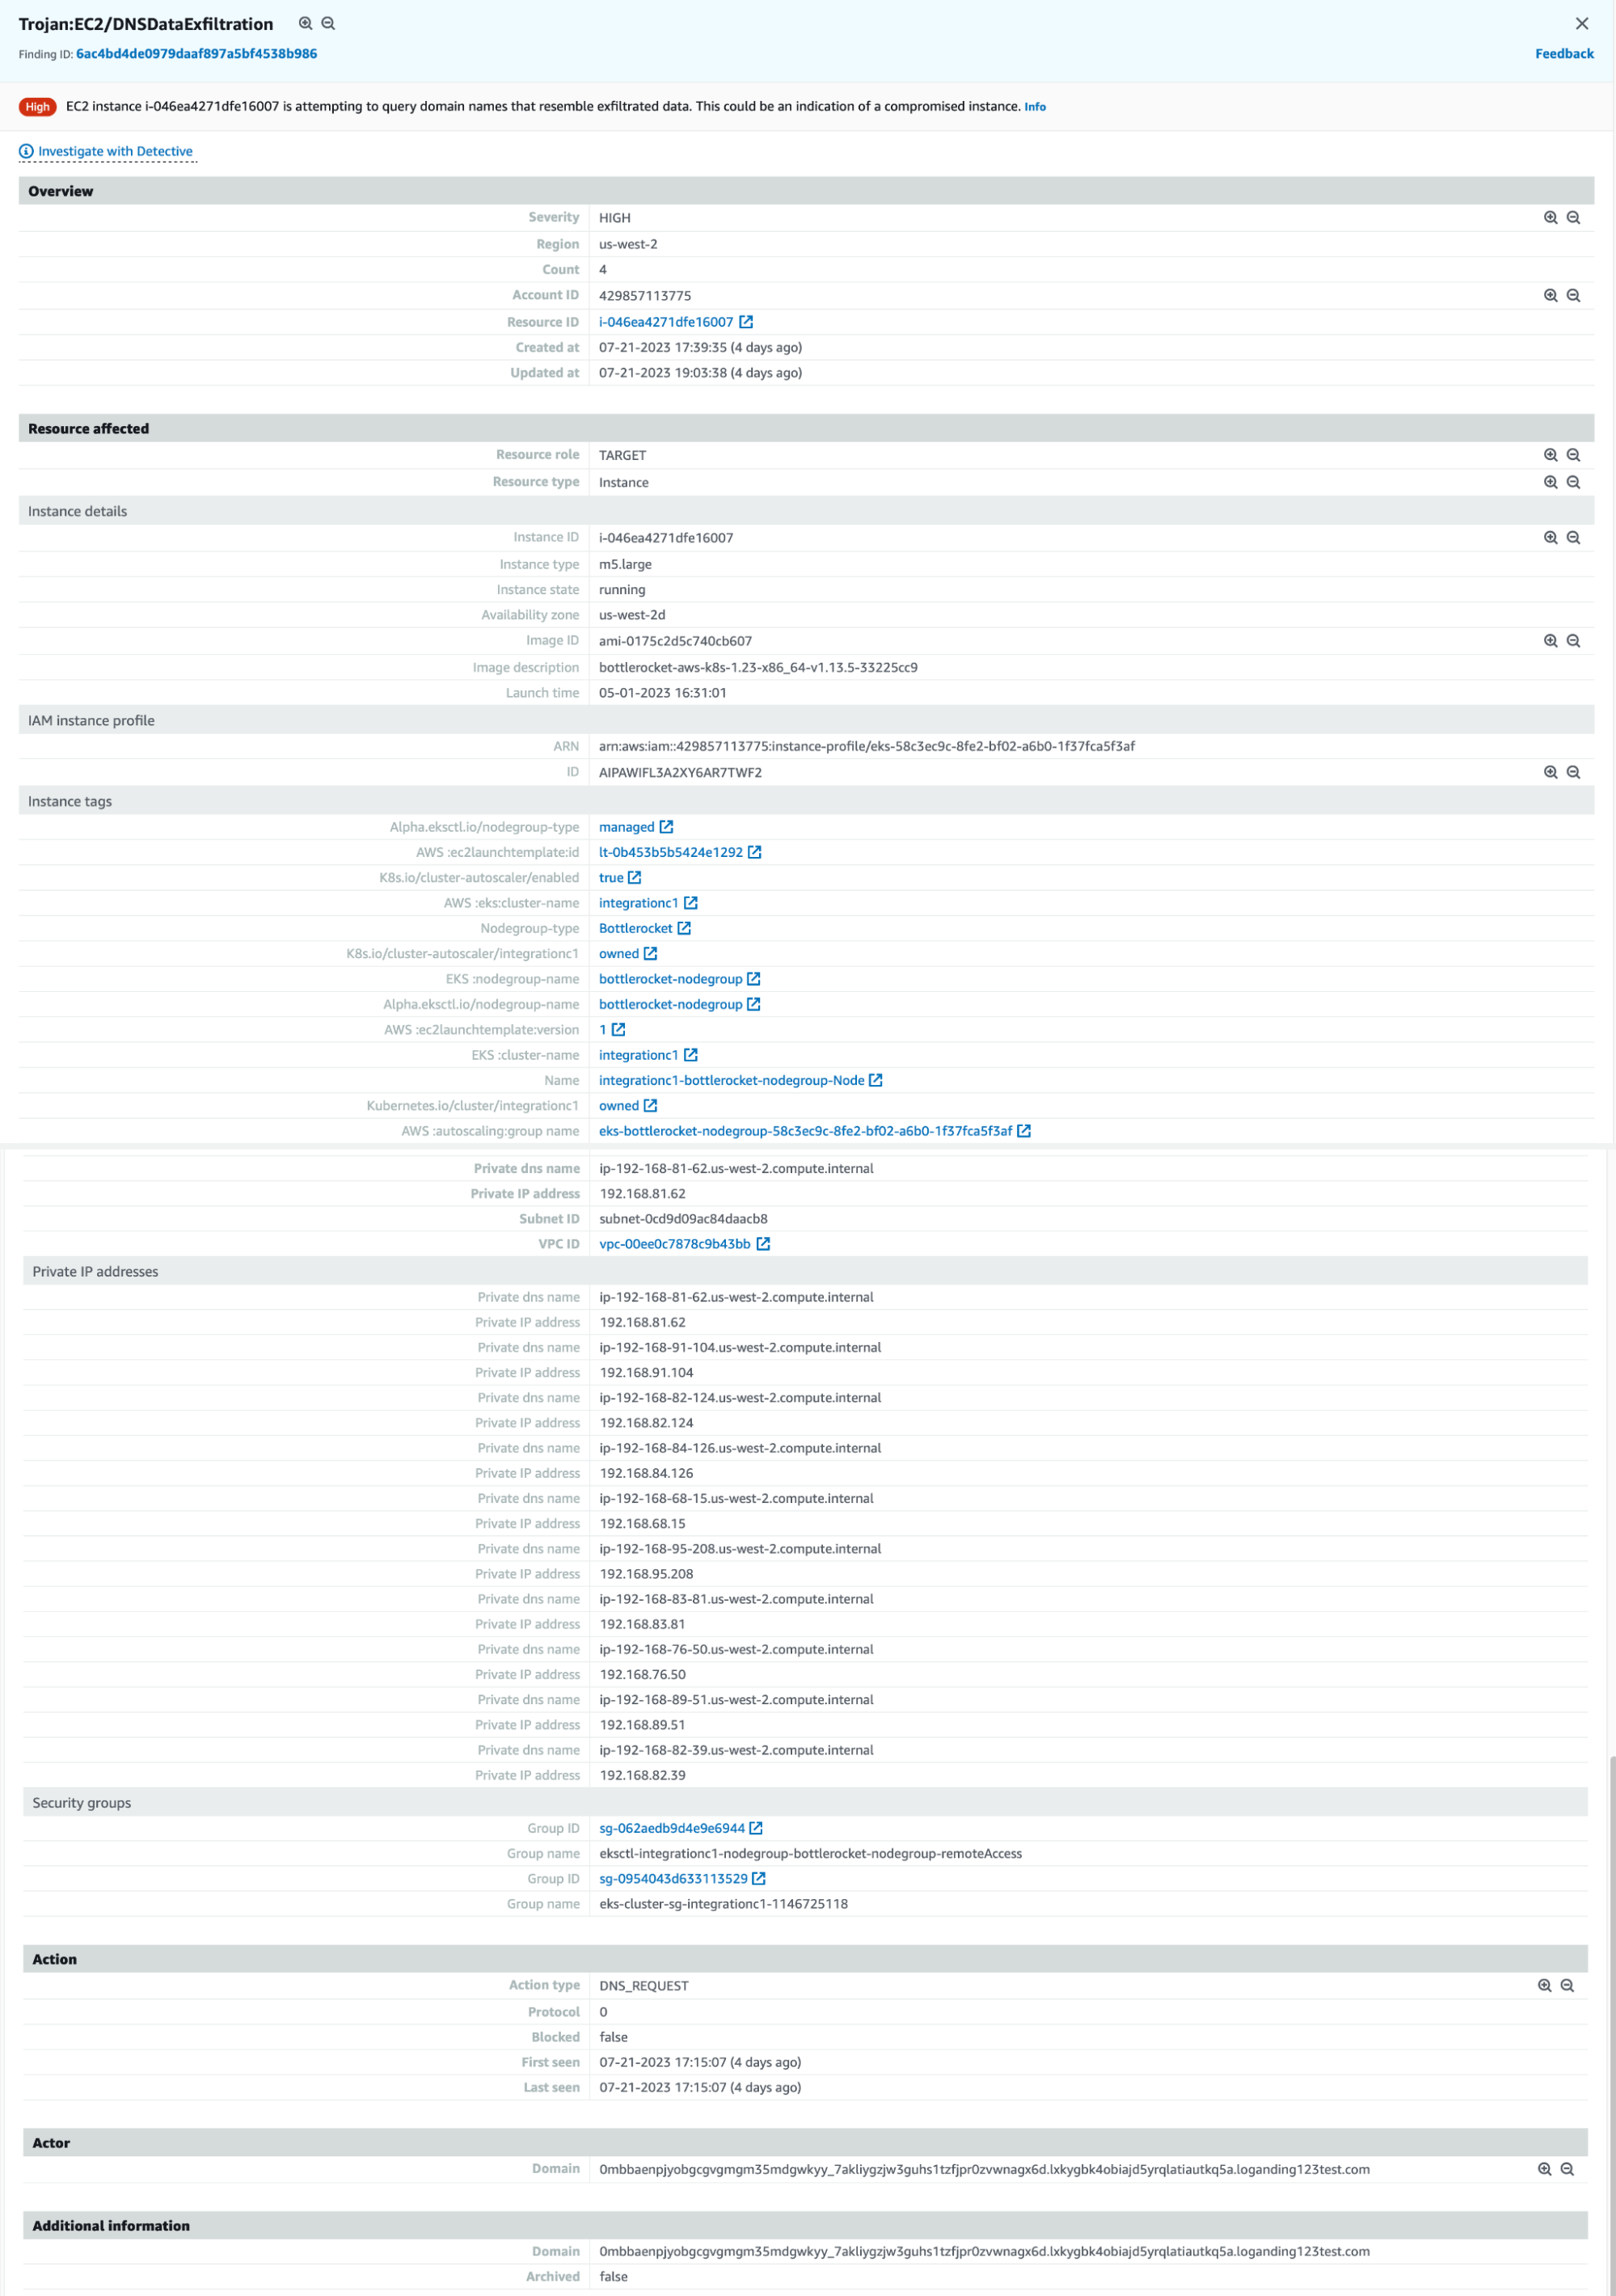
AWS GuardDuty DNS Data Exfiltration Finding
Each finding again references one of the domains queried by the dig command above. In Spyderbat, we see over 900+ connections in the records table on the bottom left have been tracked, along with their associated payload (the DNS domain queried) - and we’ve plotted a sample trace containing a few of them. Similar to the two previous cases, the domain name from the GuardDuty finding can be searched, so that we can get directly to the workload (container) and associated context for the DNS call in question.
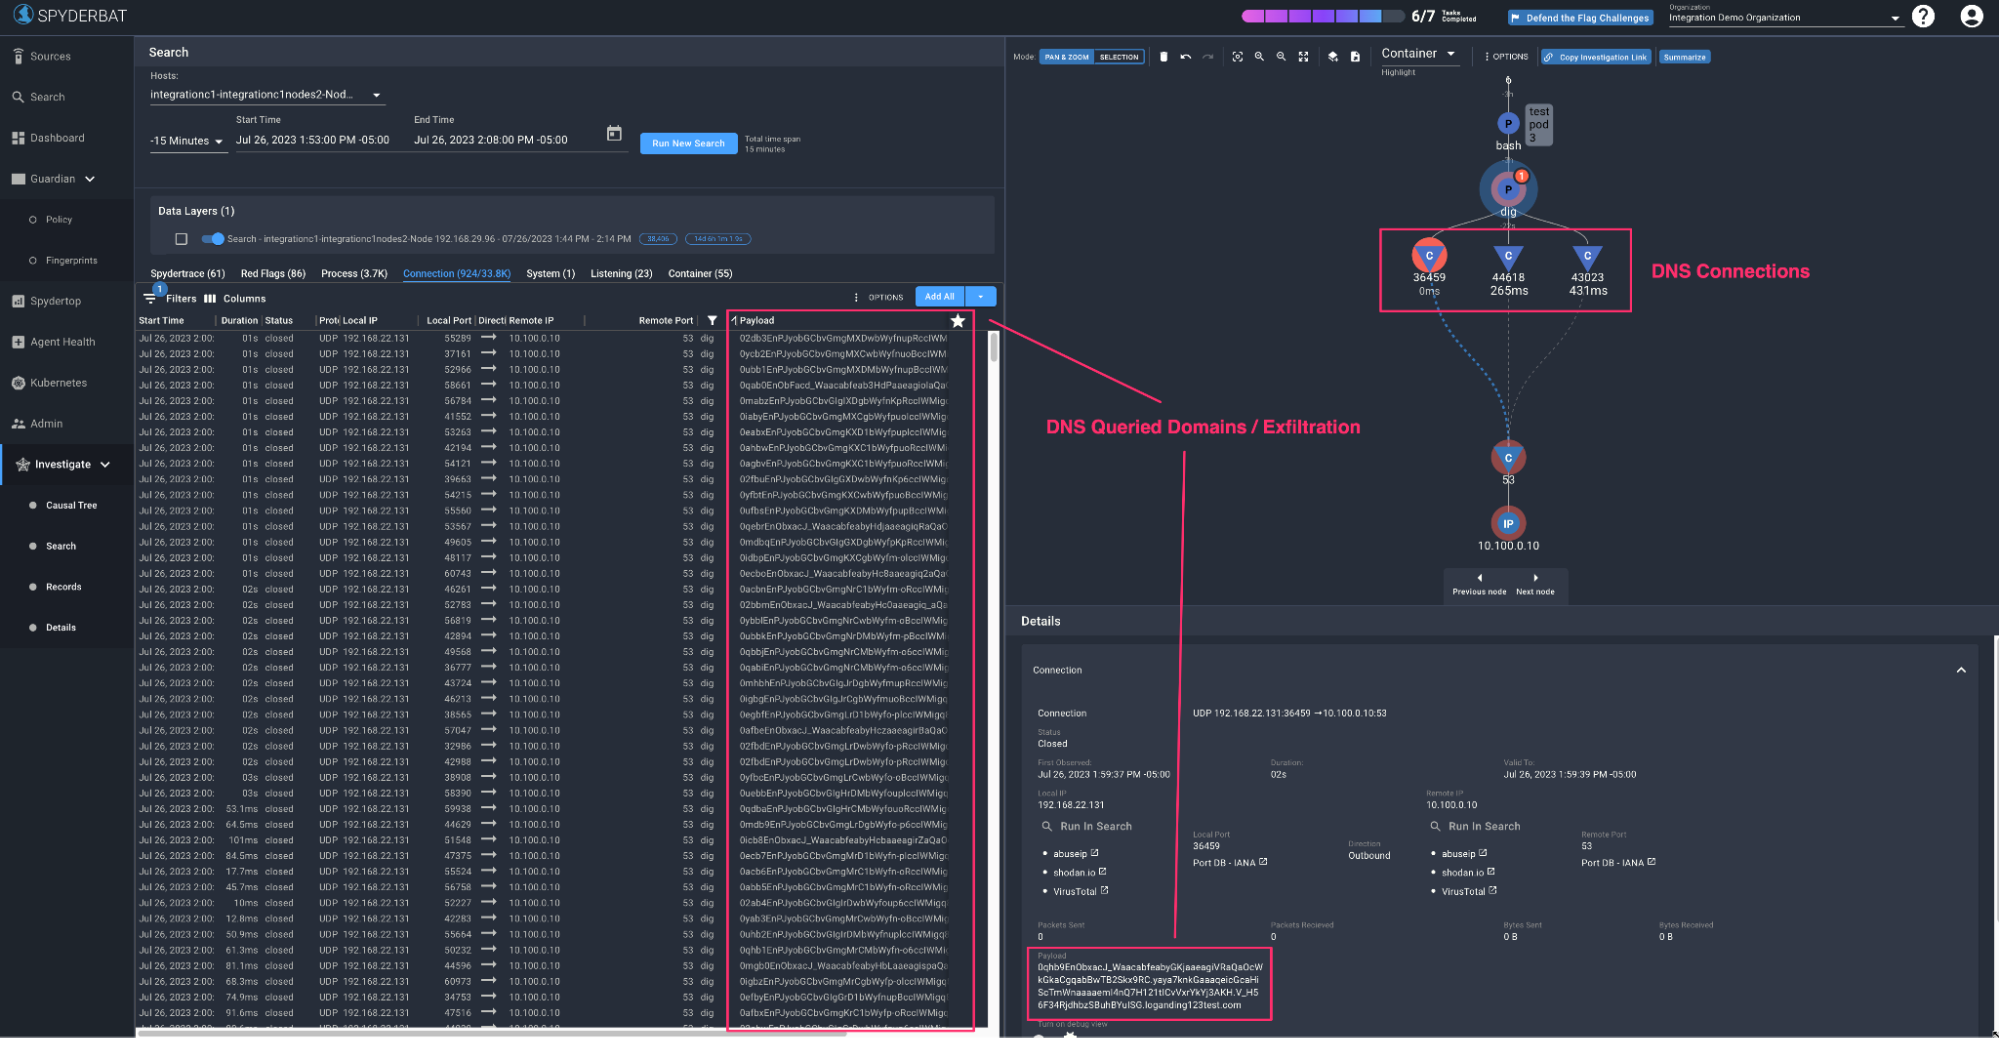
900+ DNS Connections from DNS Exfiltration
Conclusion
In this blog, we explored the enduring issue of mapping network events to the workload activity (container or VM) that generated them. We looked at this for three example GuardDuty DNS alerts or findings, but the problem applies to many other network data sources, whether it be Cloud Provider flow logs, firewalls or IDS among others. We explored an approach that flips the problem on its head as it were, by gathering the right data (eBPF et al), and continuously building and recording complete context up front all the time. Armed with this context, when we have a network event/alert, we can instantly answer the question of what workload and process started it, but also the additional context of where that process came from and so on. It turns out that this continuous context is also a game changer for accurate and timely proactive detection, response and automation and we’ll explore that in upcoming blogs.
Spyderbat: Next generation runtime security built for Kubernetes and multi-cloud
Spyderbat is the next generation runtime security providing true IDS/IPS, posture management, and remediation in runtime for Kubernetes and Multi-cloud. See how you can:
- Gain complete visibility and control in all regions by harnessing the power of eBPF Spyderbat eBPF Nano Agents.
- Collect kernel-level workload data with negligible performance impact and no management overhead (using less than 2% of resources).
- Visualize runtime activity, detect attacks, recognize anomalies, and automatically take the right action to protect app behavior and minimize downtime.
Compare Spyderbat's critical capabilities with other cloud security solutions to see where they fall short. Elevate your cloud runtime security.

Want to see Spyderbat in action?

