


Want to see Spyderbat in action?


Spyderbat is a Software as a Service (SAAS) platform, focusing on cloud native runtime security. It continuously monitors runtime context to surface risk in real time, without overwhelming alerts. But, it’s not just a monitoring or an alerting tool. Spyderbat serves as a data pool and helps you effectively visualize security in real-time and historically! It collects data after you install Spyderbat eBPF Nano agents on your Linux VMs or Kubernetes clusters and builds the data into a graph database in the Spyderbat Console with everything that has happened on your machines since then. This database encompasses a detailed record of all activities on your machines including all processes, established and closed connections, Kubernetes objects, etc. It thus becomes an extremely invaluable source of information for discerning critical events within containerized environments, and provides insights into container lifecycle events, including initiation timestamps, failure occurrences, and the reason for failure occurrences. From a security perspective, Spyderbat can also help detect and flag malicious activities, such as reverse shell attacks.
This blog will guide you through the process of extracting, analyzing, and effectively utilizing the valuable data gathered by Spyderbat, across a range of scenarios using “spyctl”. Spyctl is an open source CLI tool that is used to interact with your Spyderbat environment. It empowers you to view resources, manage resources, and create policies for your containers and services.
Before we get started, check out the documentation for installing spyctl. It takes you from setting up the spyctl context to spyctl’s basic usage.
Let’s get started by discussing the various use cases of leveraging Spyctl to get the desired data.
The outline of the Scenarios is as follows:
- Scenario 1: Getting started with spyctl and using spyctl’s `get` command to retrieve historical resource data.
- Scenario 2a: Finding containers that made a DNS request.
- Scenario 2b: Discovering connection information for a specific port and finding the linked container and container image.
Scenario 1:
Imagine you are the administrator of a Kubernetes cluster in a large organization that uses Spyderbat, and you want to take a look at the status of all the pods running across 1000s of clusters, including their respective namespaces and associated cluster-related data. The real question to ask is, “How can I view the pod data across all or some of the clusters at once?” Well, the answer is simple – use spyctl.
You can think of spyctl like Kubectl or Spyderbat deployments, with some additional impressive functionality. For example, the command spyctl get pods gets you every pod for every cluster deployed in your Spyderbat organization, unlike Kubectl, which requires you to change the context every time you want to know about the pods in a different cluster.
Assuming your company installed the nano agent on the clusters, you can get all the pod information using just one simple command, as follows:
$ spyctl get pods

This gives you the name, state, last seen in YYYY-MM-ddTHH:mm:ss, status, number of restarts of the pod, pod age, namespace, and the cluster of the pod for the last 24 hours by default.
If you’re only interested in pods in one or a subset of your clusters use the cluster filtering as spyctl get pods –cluster <cluster_name_1>[,<cluster_name_2>]
$ spyctl get pods –cluster dev-cluster

There are various filtering options and formatting options available for each resource (pods, agents, machines, etc) in Spyderbat which you can get using spyctl get –help. Spyctl also allows you to use multiple filtering options at once to get the exact information you need.
With spyctl you can also time travel for up to 30 days in the past with the free tier accounts. You can do this with the -t option to set the start time and the -e option to set the end time as follows:
$ spyctl get pods -t 30d - e 5d
-t 30d and -e 5d will list pods observed by Spyderbat between 30 days to 5 days ago. You can also see that the Spyderbat nanoagent gets deployed as a pod in the Spyderbat namespace.
For Spyderbat's paying customers, this time-travel window extends to 90 days or more. If you don’t supply the end time, the default is considered as the current day, minute, and second i.e to get all the pods observed by Spyderbat within the previous 89 days, you can run:
$ spyctl get pods -t 89d

You can also get a particular pod by supplying the pod name or ID with $ spyctl get pods pod_name as below:
$ spyctl get pods gd-test
It works like grep and lists all the matching pods to the provided pod_name.
Scenario 2a:
Now that we have somewhat explored spyctl, let’s delve into the question. Ever wondered, "How do I identify the container responsible for a specific DNS request?" If so, this scenario is tailor-made for you. If you've encountered security alerts for suspicious DNS activity, or if your DevOps team has noticed a spike in DNS server loads, knowing which container or process made the request becomes crucial.
Kubernetes itself does not provide native tools or mechanisms for directly associating DNS requests with applications or processes. With Spyderbat you can easily gain network visibility and monitoring within your Kubernetes clusters.
Using spyctl, you can retrieve information related to DNS queries and the exact pod that queried it. With this data, you can enhance network security by enforcing policies to identify and block suspicious or malicious DNS traffic. We’re going to use spyctl to retrieve the connection and container data and then process it with a script here.
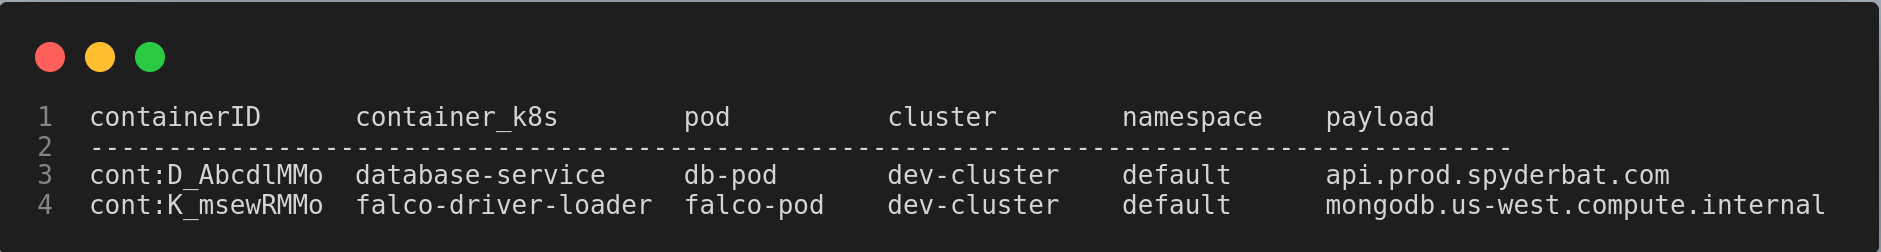
Our motive is to get information about the connections to port 53, its originating container, the specific pod it belongs to, the cluster, the namespace, and the payload associated with each DNS query. We should be able to accomplish the output below by the end of this scenario:
The scenario can be accomplished in 2 steps:
- Step 1: To gather detailed information about our resources, we employ two spyctl commands and redirect the output to their specific files:
- spyctl get connections -o json –ndjson –remote-port 53 > connections53.json
- spyctl get containers -o json –ndjson > containers53.json
- These commands retrieve resource data in the ndjson format in their respective files while filtering for remote port 53, the standard port for DNS traffic. In our script, we then open and process this file to extract insights into network connections. Note that remote port filtering only makes sense for connections. Again, to know all the filtering options, use spyctl get -h .
- Step 2: Final step - Using the script to achieve our desired output as below.
We have included comments throughout the script to facilitate a better understanding of its functionality. To, establish connections between the data set of “connections” and the “containers” we match them using the unique identifier known as container_uid present in both. The column container_k8s, pod, namespace, and cluster in the output are grabbed from the matched container records.
The diagram below shows how you can link the two resources using a common field or a primary key. The easiest way to think about it is using a unique identifier field for the resource that you want to match up the data with. For example, to retrieve cluster info related to a pod i.e. pod —> cluster we could use the cluster_uid and so on.

Scenario 2b:
Imagine your company is looking to enhance its network security by closely monitoring connections to a specific port, namely, port 8126. The main goal is to pinpoint containers that might be involved in suspicious or unauthorized network activities. In the event of a security incident or suspicious activity, the ability to quickly trace containers and their images allows for a more efficient incident response.
Thus, how can one effectively monitor connections to port 8126 to identify containers engaged in potentially suspicious or unauthorized network activities while also gathering relevant information about their container images and image IDs?
Using spyctl, we can get our desired data in just two steps as in the previous Scenario.
Step 1: Employing the spyctl commands by filtering for port 8126:
- spyctl get connections -o json –ndjson –remote-port 8126 > connections8126.json
- spyctl get container -o json –ndjson > containers8126.json
FYI, with the container_uid as the link between connections and containers, we can easily get important details about the container, like its image and when it was created to understand its origins! Onto the final step below.
Step 2: Implementing the Python script here for the desired output.
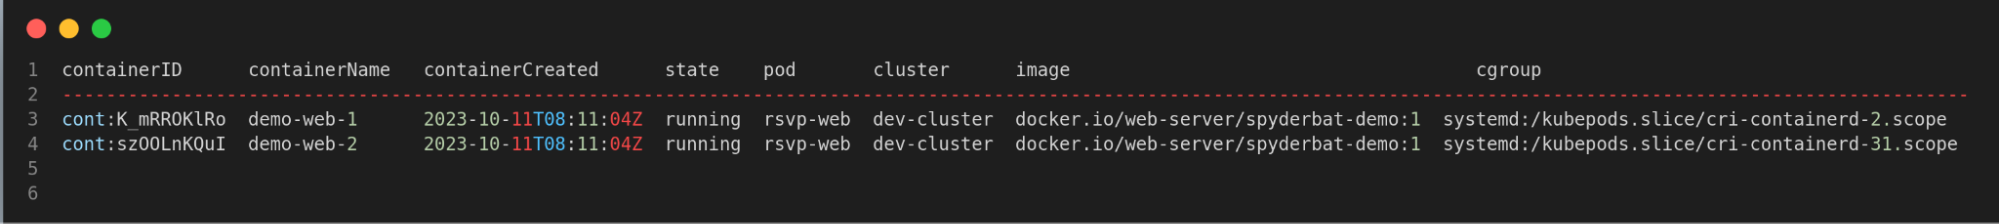
The output response has the following information – the container, the pod, the cluster, the state of the container, the container start time, and an image associated with the container
Once we match up the container_uid from connections to containers we get a plethora of information about the container environment, container start time, mounts, etc. Make sure to check out the data and modify the test as per the need.
Conclusion:
We have covered the use of spyctl and how using the combined power of spyctl and data correlation using a primary key, we can investigate the granular data, and uncover its origins and relationships to other objects. By using our diagram effectively, you can visually demonstrate how Spyderbat connects the dots within your cloud-native environment's data to help you understand and respond to critical events and security incidents. With this information, we can proactively safeguard our containerized environment by taking further steps.
More to come in part 2!
Want to see Spyderbat in action?

